

Optimism extends its downward price move as intraday sellers dominate trading

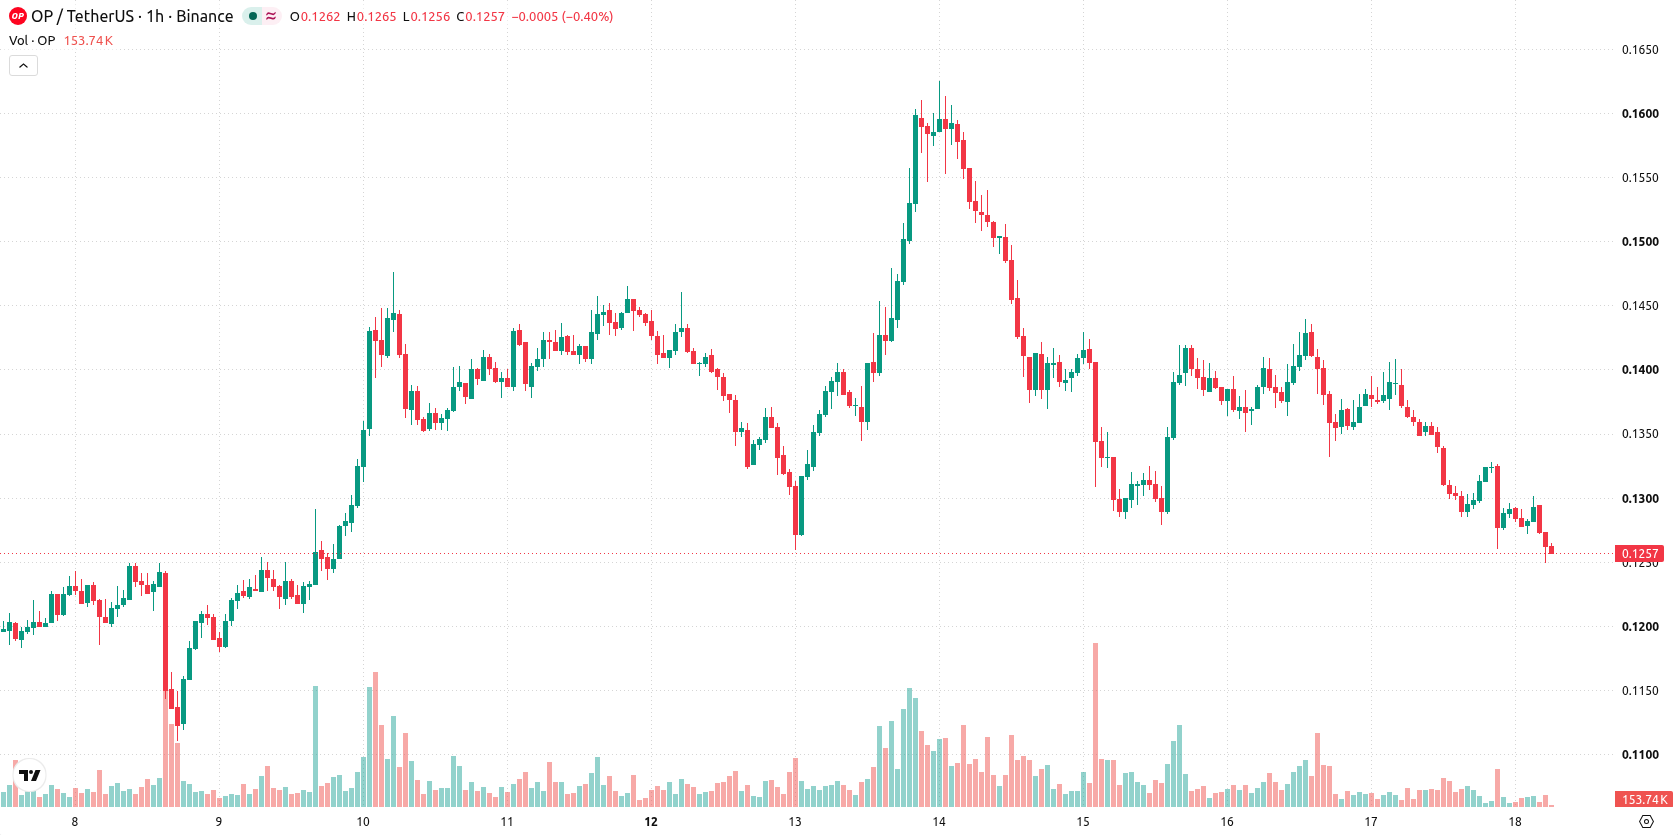
Optimism (OP) is trading at $0.126, marking a daily decline of 8.36%. The price sits below its key moving averages in the short and medium term, while remaining above its long-term average.
 0.115
0.1228
Highlights
- OP/USD trades below key short- and medium-term moving averages, showing persistent seller pressure in the current session.
- Momentum and oscillator indicators signal broad bearishness, with the asset down 8.36% to $0.126 and no reversal confirmed.
- Forecast range for the next 1 to 2 trading days is $0.1178 to $0.1342, with a very high probability of further downside.
Selling pressure prevails as momentum signals align bearish
On the hourly chart, OP/USD is positioned below MA-20 at $0.1299 and MA-50 at $0.1348, but remains above the MA-200 level of $0.112. The Ichimoku Kijun marks immediate resistance at $0.1334. Momentum indicators reinforce selling pressure, with both MACD and ADX giving Sell signals. The RSI reads 34.4, and CCI is in Oversold territory. Stoch RSI and Awesome Oscillator are Neutral, though Bull/Bear Power highlights continued intraday seller dominance.
Downside favored as volatility band constrains direction
For the next 1–2 trading days, OP/USD is forecast to oscillate between $0.1178 and $0.1342, with a very high probability assigned to further downside and a very low chance of an upward rebound. Continuation within this volatility band is expected unless the pair breaks above $0.1334 (bullish scenario) or falls below $0.1178 (bearish scenario), in which case a new directional move could unfold.
Earlier, analysts noted that Optimism was exhibiting sustained short- and medium-term weakness with a prevailing bearish outlook. The latest price action reinforces this assessment, with traders advised to monitor the $0.1178 support level for any imminent downside extension.










-
 Afghanistan
-
 Albania
-
 Algeria
-
 Angola
-
 Argentina
-
 Armenia
-
 Australia
-
 Austria
-
 Azerbaijan
-
 Bahamas
-
 Bahrain
-
 Bangladesh
-
 Belarus
-
 Belgium
-
 Bolivia
-
 Botswana
-
 Brazil
-
 Brunei
-
 Bulgaria
-
 Cambodia
-
 Cameroon
-
 Canada
-
 Chile
-
 China
-
 Colombia
-
 Congo
-
 Costa Rica
-
 Cote d'Ivoire
-
 Croatia
-
 Cuba
-
 Cyprus
-
 Czechia
-
 DR Congo
-
 Denmark
-
 Dominican Republic
-
 Ecuador
-
 Egypt
-
 El Salvador
-
 Estonia
-
 Eswatini
-
 Ethiopia
-
 Finland
-
 France
-
 Georgia
-
 Germany
-
 Ghana
-
 Greece
-
 Haiti
-
 Hong Kong
-
 Hungary
-
 India
-
 Indonesia
-
 Iran, Islamic republic
-
 Iraq
-
 Ireland
-
 Israel
-
 Italy
-
 Jamaica
-
 Japan
-
 Jordan
-
 Kazakhstan
-
 Kenya
-
 Korea
-
 Kuwait
-
 Kyrgyzstan
-
 Laos
-
 Latvia
-
 Lebanon
-
 Lesotho
-
 Libya
-
 Lithuania
-
 Luxembourg
-
 Madagascar
-
 Malaysia
-
 Malta
-
 Mauritius
-
 Mexico
-
 Moldova
-
 Mongolia
-
 Montenegro
-
 Morocco
-
 Mozambique
-
 Myanmar
-
 Namibia
-
 Nepal
-
 Netherlands
-
 New Zealand
-
 Nigeria
-
 North Macedonia
-
 Norway
-
 Oman
-
 Pakistan
-
 Palestine
-
 Panama
-
 Papua New Guinea
-
 Paraguay
-
 Peru
-
 Philippines
-
 Poland
-
 Portugal
-
 Puerto Rico
-
 Qatar
-
 Reunion
-
 Romania
-
 Rwanda
-
 Saudi Arabia
-
 Serbia
-
 Singapore
-
 Slovakia
-
 Slovenia
-
 Somalia
-
 South Africa
-
 Spain
-
 Sri Lanka
-
 Sweden
-
 Switzerland
-
 Syria
-
 Taiwan
-
 Tajikistan
-
 Tanzania
-
 Thailand
-
 Trinidad and Tobago
-
 Tunisia
-
 Turkey
-
 UAE
-
 Uganda
-
 Ukraine
-
 United Kingdom
-
United States
-
 Uruguay
-
 Uzbekistan
-
 Venezuela
-
 Vietnam
-
 Yemen
-
 Zambia
-
 Zimbabwe
- Forex
- Crypto












