

Render faces pressure below Ichimoku Kijun resistance with mixed momentum readings: weekly analysis

Render Network (RENDER) is trading near $1.84 after slipping almost 4% this week, stretching its recent decline into oversold territory. The daily chart signals conflicting momentum as key indicators diverge, with price action testing critical support zones. In the coming week, how the market reacts to these pressure points will be crucial for the next directional move.
 1.876
2.2330
1.876
2.2330
Highlights
- Render trades at $1.84, down 3.96% over the past week, remaining above long-term moving averages.
- Technical indicators signal mixed momentum, with the token oversold on some oscillators but maintaining a bullish long-term structure.
- Render is expected to consolidate in the $1.6087 to $2.182 range, with key support at $1.796 and resistance at $1.956.
Operational growth and AI adoption drive attention amid fresh partnership news
Recent operational advances on the Render Network have drawn attention, particularly as the network surpassed 82 million frames processed in recent days, according to TronWeekly. A governance vote led to the onboarding of 60,000 additional GPUs for processing, while AI workloads now account for roughly 35 to 40 percent of all jobs on the network, OpenPR reported. In other developments, CoinDCX highlighted the integration of Salad, a distributed home GPU network, following a Render community proposal approved earlier in the year. Additionally, OpenPR noted that Render and Solana are collaborating on a 3D art event in London scheduled for November 16, 2026.
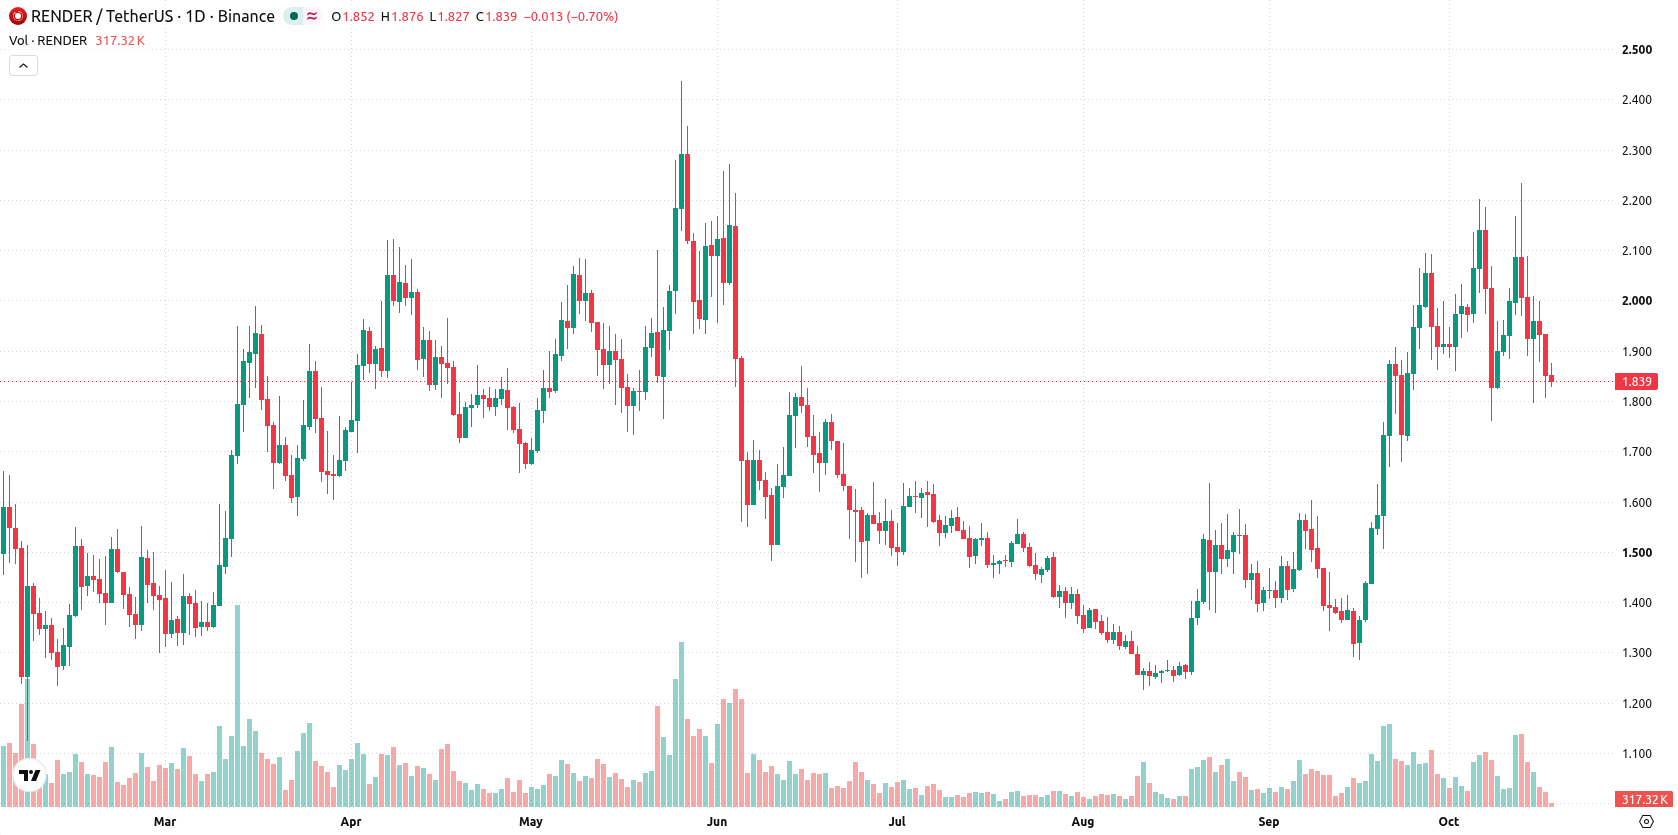
Support holds firm as mixed technical signals and high volatility shape momentum
The daily chart shows Render in a sustained move lower with a firm trend, as confirmed by a trending ADX and high 24.33% volatility. MACD remains on a Strong Buy forecast, but both the CCI (-115.9943) and Stochastic RSI are in oversold territory, highlighting mixed momentum signals. Immediate support is seen at $1.796, while the Ichimoku Kijun at $1.956 sets the nearest resistance. With price pinned near support and conflicting signals, the next move hinges on buyers defending current levels.
Consolidation expected as breakout risk builds around support and resistance
Over the next 7 days, Render is expected to trade between $1.6087 and $2.182. The probability of an increase stands at 57%, while the probability of a decrease is 43%. The base case anticipates consolidation within this range, reacting to buyer and seller pressure around $1.796 and $1.956. A sustained breakout above $1.956 could open a push towards $2.182, while a breakdown below $1.796 would risk further downside towards $1.6087.
Earlier, analysts noted that Render's technical setup had shifted to reflect an increased potential for upward movement, pending confirmation from sustained price action. The current review signals a divergence in momentum with price now testing support, making the reaction to the $1.796 level a decisive factor for short-term direction.





Latest Render News





-
 Afghanistan
-
 Albania
-
 Algeria
-
 Angola
-
 Argentina
-
 Armenia
-
 Australia
-
 Austria
-
 Azerbaijan
-
 Bahamas
-
 Bahrain
-
 Bangladesh
-
 Belarus
-
 Belgium
-
 Bolivia
-
 Botswana
-
 Brazil
-
 Brunei
-
 Bulgaria
-
 Cambodia
-
 Cameroon
-
 Canada
-
 Chile
Chile
-
 China
China
-
 Colombia
-
 Congo
Congo
-
 Costa Rica
-
 Cote d'Ivoire
-
 Croatia
-
 Cuba
Cuba
-
 Cyprus
-
 Czechia
-
 DR Congo
-
 Denmark
-
 Dominican Republic
-
 Ecuador
-
 Egypt
Egypt
-
 El Salvador
-
 Estonia
-
 Eswatini
-
 Ethiopia
-
 Finland
-
 France
-
 Georgia
-
 Germany
-
 Ghana
Ghana
-
 Greece
-
 Haiti
Haiti
-
 Hong Kong
-
 Hungary
-
 India
India
-
 Indonesia
-
 Iran, Islamic republic
-
 Iraq
Iraq
-
 Ireland
-
 Israel
-
 Italy
Italy
-
 Jamaica
-
 Japan
Japan
-
 Jordan
-
 Kazakhstan
-
 Kenya
Kenya
-
 Korea
Korea
-
 Kuwait
-
 Kyrgyzstan
-
 Laos
Laos
-
 Latvia
-
 Lebanon
-
 Lesotho
-
 Libya
Libya
-
 Lithuania
-
 Luxembourg
-
 Madagascar
-
 Malaysia
-
 Malta
Malta
-
 Mauritius
-
 Mexico
-
 Moldova
-
 Mongolia
-
 Montenegro
-
 Morocco
-
 Mozambique
-
 Myanmar
-
 Namibia
-
 Nepal
Nepal
-
 Netherlands
-
 New Zealand
-
 Nigeria
-
 North Macedonia
-
 Norway
-
 Oman
Oman
-
 Pakistan
-
 Palestine
-
 Panama
-
 Papua New Guinea
-
 Paraguay
-
 Peru
Peru
-
 Philippines
-
 Poland
-
 Portugal
-
 Puerto Rico
-
 Qatar
Qatar
-
 Reunion
-
 Romania
-
 Rwanda
-
 Saudi Arabia
-
 Serbia
-
 Singapore
-
 Slovakia
-
 Slovenia
-
 Somalia
-
 South Africa
-
 Spain
Spain
-
 Sri Lanka
-
 Sweden
-
 Switzerland
-
 Syria
Syria
-
 Taiwan
-
 Tajikistan
-
 Tanzania
-
 Thailand
-
 Trinidad and Tobago
-
 Tunisia
-
 Turkey
-
 UAE
UAE
-
 Uganda
-
 Ukraine
-
 United Kingdom
-
United States
-
 Uruguay
-
 Uzbekistan
-
 Venezuela
-
 Vietnam
-
 Yemen
Yemen
-
 Zambia
-
 Zimbabwe
- Forex
- Crypto












