

Celestia weekly forecast: Buyers push higher but momentum looks stretched

Celestia (TIA) is trading around $0.64 after gaining about 2% over the past week as buyers press for higher levels, though momentum is beginning to look stretched. The Eden launch has created strong interest and shaped trading behavior heading into the new week, with volatility remaining elevated as the market awaits signs of continued demand.
 0.4479
0.5697
Highlights
- Celestia trades at $0.6365, up 2.22% over the past week, holding well above long-term moving averages.
- The primary trend remains bullish with buyers in control, supported by strong trending signals from MACD and ADX.
- Near-term support sits at $0.595 with resistance at $0.769, and the expected 7-day range is $0.5092 to $0.7638.
Eden chain debut and buyback reshape sentiment as ecosystem develops
Celestia launched Eden, a high-performance EVM chain for experiments in agentic commerce and autonomous AI agents, on October 16, 2026. The new Eden chain uses the Evolve stack and TIA as its gas token, posting transaction data to Celestia, opening new blockchain-enabled use cases according to TokenPost. CoinCentral also reported that Celestia executed a buyback agreement to reclaim 43 million TIA from Polychain.
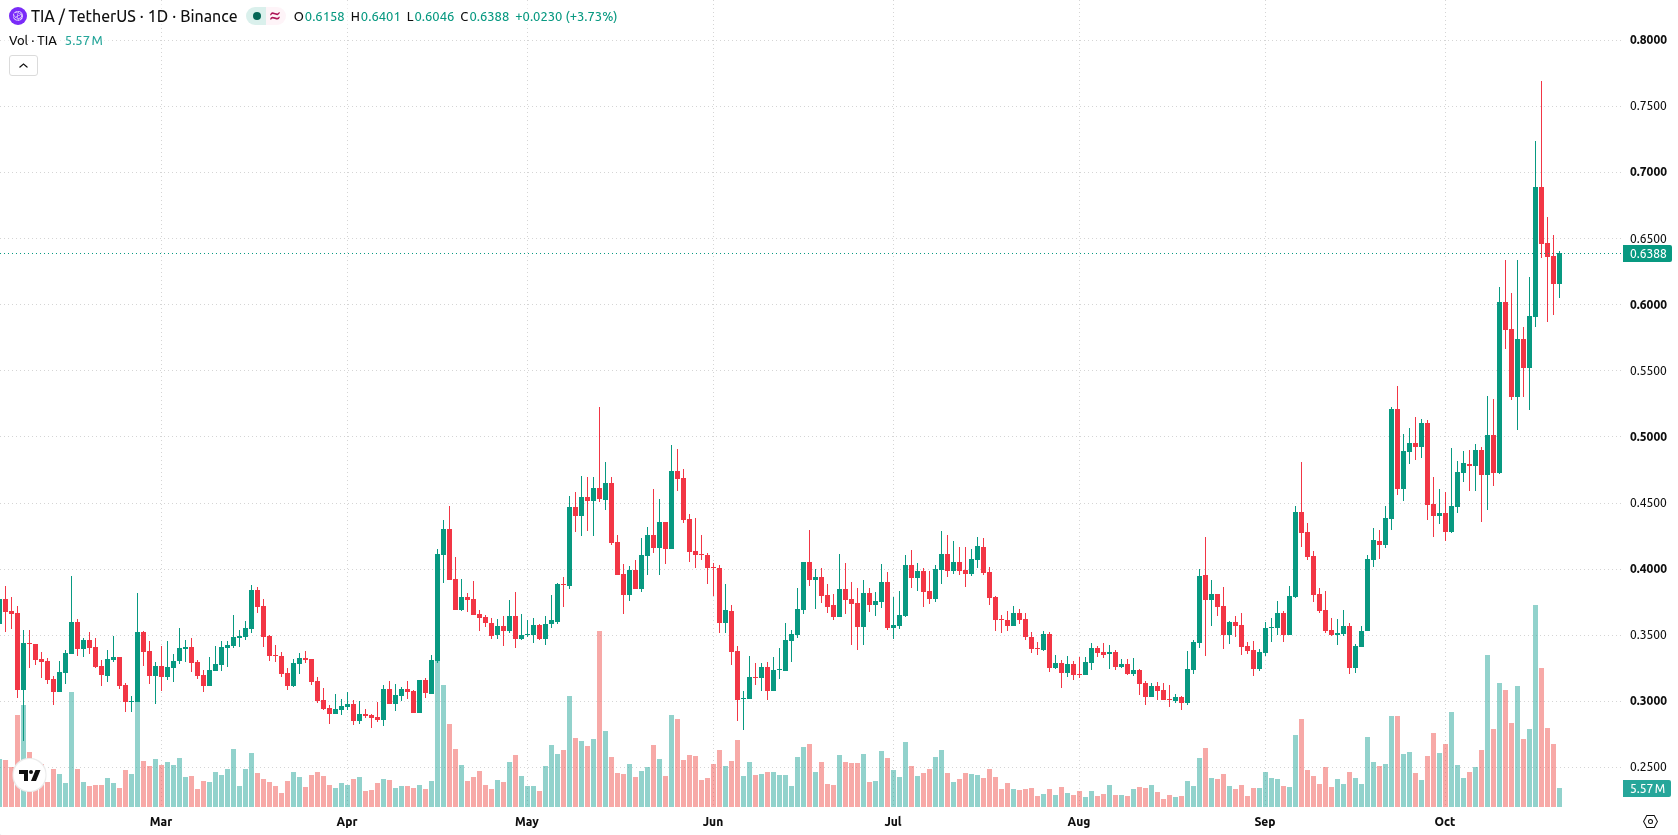
Persistent bullish momentum as daily indicators signal upside remains
The daily chart shows a sustained move higher with a firm trend, as reflected by the trending structure and 47.83% volatility over the past week. MACD and ADX both signal bullish momentum, while RSI at 58.5618 remains neutral, suggesting there is still room before reaching overbought conditions. Immediate support is seen at $0.595 from the Ichimoku Kijun, with resistance at the recent high of $0.769. These levels are likely to guide the action in the coming days, with overall signals indicating buyers remain in charge despite the recent volatility.
Bullish breakout risk intensifies as resistance nears in coming week
Over the next 7 days, the expected range is $0.5092 to $0.7638. There is a very high probability (more than 80%) of an increase, and a very low probability (less than 20%) of a decrease. The base case is that Celestia holds above $0.595 and tests resistance at $0.769. A bullish break above $0.769 could accelerate gains toward the top of the expected range, while a drop below $0.595 would expose downside toward the $0.5092 level.
Earlier, analysts noted that Celestia’s Eden launch initially triggered heightened volatility and a shift toward short-term bearish momentum. The current technical outlook, however, demonstrates a notable improvement in buying pressure and trend structure, making a decisive move through the $0.769 resistance the key level to watch for further upside.










-
 Afghanistan
-
 Albania
-
 Algeria
-
 Angola
-
 Argentina
-
 Armenia
-
 Australia
-
 Austria
-
 Azerbaijan
-
 Bahamas
-
 Bahrain
-
 Bangladesh
-
 Belarus
-
 Belgium
-
 Bolivia
-
 Botswana
-
 Brazil
-
 Brunei
-
 Bulgaria
-
 Cambodia
-
 Cameroon
-
 Canada
-
 Chile
-
 China
-
 Colombia
-
 Congo
-
 Costa Rica
-
 Cote d'Ivoire
-
 Croatia
-
 Cuba
-
 Cyprus
-
 Czechia
-
 DR Congo
-
 Denmark
-
 Dominican Republic
-
 Ecuador
-
 Egypt
-
 El Salvador
-
 Estonia
-
 Eswatini
-
 Ethiopia
-
 Finland
-
 France
-
 Georgia
-
 Germany
-
 Ghana
-
 Greece
-
 Haiti
-
 Hong Kong
-
 Hungary
-
 India
-
 Indonesia
-
 Iran, Islamic republic
-
 Iraq
-
 Ireland
-
 Israel
-
 Italy
-
 Jamaica
-
 Japan
-
 Jordan
-
 Kazakhstan
-
 Kenya
-
 Korea
-
 Kuwait
-
 Kyrgyzstan
-
 Laos
-
 Latvia
-
 Lebanon
-
 Lesotho
-
 Libya
-
 Lithuania
-
 Luxembourg
-
 Madagascar
-
 Malaysia
-
 Malta
-
 Mauritius
-
 Mexico
-
 Moldova
-
 Mongolia
-
 Montenegro
-
 Morocco
-
 Mozambique
-
 Myanmar
-
 Namibia
-
 Nepal
-
 Netherlands
-
 New Zealand
-
 Nigeria
-
 North Macedonia
-
 Norway
-
 Oman
-
 Pakistan
-
 Palestine
-
 Panama
-
 Papua New Guinea
-
 Paraguay
-
 Peru
-
 Philippines
-
 Poland
-
 Portugal
-
 Puerto Rico
-
 Qatar
-
 Reunion
-
 Romania
-
 Rwanda
-
 Saudi Arabia
-
 Serbia
-
 Singapore
-
 Slovakia
-
 Slovenia
-
 Somalia
-
 South Africa
-
 Spain
-
 Sri Lanka
-
 Sweden
-
 Switzerland
-
 Syria
-
 Taiwan
-
 Tajikistan
-
 Tanzania
-
 Thailand
-
 Trinidad and Tobago
-
 Tunisia
-
 Turkey
-
 UAE
-
 Uganda
-
 Ukraine
-
 United Kingdom
-
United States
-
 Uruguay
-
 Uzbekistan
-
 Venezuela
-
 Vietnam
-
 Yemen
-
 Zambia
-
 Zimbabwe
- Forex
- Crypto












