

Celestia tumbles after extended selloff: TIA remains under pressure

Celestia (TIA) is trading at $0.3094, down 7.11% over the last 24 hours. The asset remains below its key moving averages, and the price action is positioned near the day's low amid elevated volatility.
 0.3316
0.3643
Highlights
- Celestia's TIA token price fell about 39% over a 28-day period, extending a significant decline.
- Consistent selling activity reduced investor liquidity and contributed to weaker short-term demand for TIA.
- TIA trades near $0.3094 with bearish technical momentum, a projected range of $0.2893 to $0.321 and a further decline likely.
Investor liquidity shrinks as sustained selling drags sentiment lower
Celestia's TIA token saw an approximate 39% decline over a period of about 28 days, as reported by Thedefiant. This extended drop likely reflects a period of consistent selling activity, which has reduced investor liquidity and contributed to weaker short-term demand. The persistent loss in value has negatively affected market sentiment, consistent with ongoing downward pressure across the token's recent performance window.
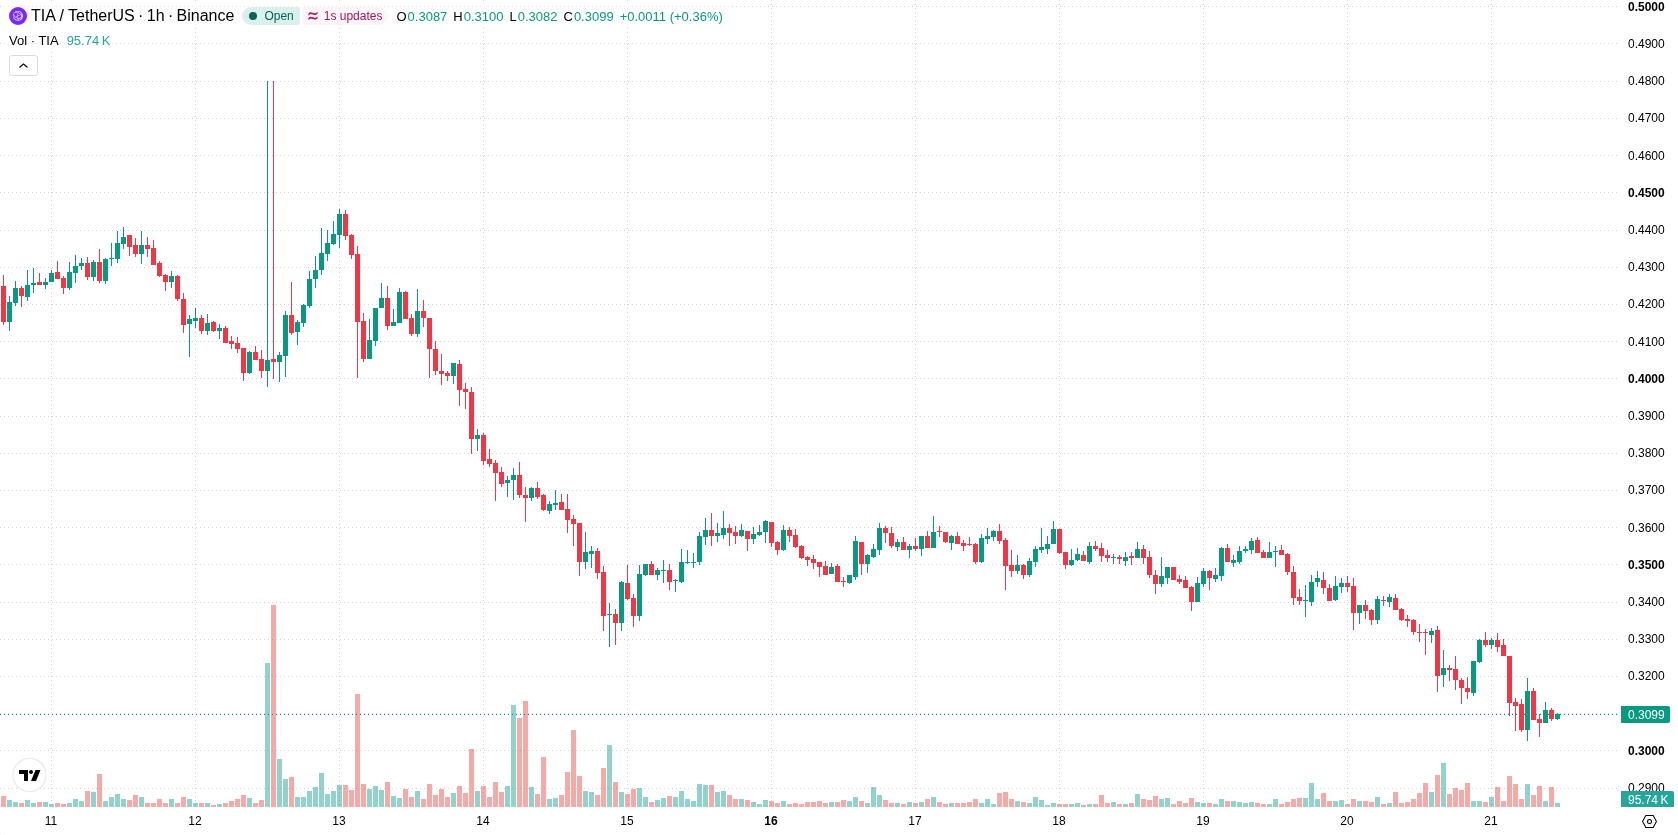
Key resistance levels and weak momentum reinforce bearish pressure
Technical analysis reveals TIA is trading below the H1 SMA-20 at $0.3183, H1 SMA-50 at $0.3323, and D1 SMA-200 at $0.405. The Ichimoku Kijun at $0.3203 is acting as immediate resistance. Momentum signals remain weak: MACD and ADX indicate a sell setup, while readings on RSI, Stochastic RSI, and CCI are neutral. Bull/Bear Power stands at -0.0042, indicating sellers are in control over intraday momentum, with the Awesome Oscillator offering a neutral bias.
Downside risk dominates as consolidation likely within tight range
Looking ahead to the next two to three sessions, the expected volatility band is $0.2893 to $0.321. The likelihood of an upside move remains very low, while a further decline remains much more probable. The base scenario anticipates consolidation within this corridor. A bullish setup would require a sustained push above immediate resistance, while a bearish scenario could develop if price breaks below the $0.2893 support level.
Earlier, analysts noted that Celestia’s overall trend remained decisively bearish, with technical indicators supporting a continued downside bias. The current analysis reinforces this view, highlighting persistent sell pressure and focusing attention on the $0.2893 support as a critical level that could trigger further declines if breached.










-
 Afghanistan
-
 Albania
-
 Algeria
-
 Angola
-
 Argentina
-
 Armenia
-
 Australia
-
 Austria
-
 Azerbaijan
-
 Bahamas
-
 Bahrain
-
 Bangladesh
-
 Belarus
-
 Belgium
-
 Bolivia
-
 Botswana
-
 Brazil
-
 Brunei
-
 Bulgaria
-
 Cambodia
-
 Cameroon
-
 Canada
-
 Chile
-
 China
-
 Colombia
-
 Congo
-
 Costa Rica
-
 Cote d'Ivoire
-
 Croatia
-
 Cuba
-
 Cyprus
-
 Czechia
-
 DR Congo
-
 Denmark
-
 Dominican Republic
-
 Ecuador
-
 Egypt
-
 El Salvador
-
 Estonia
-
 Eswatini
-
 Ethiopia
-
 Finland
-
 France
-
 Georgia
-
 Germany
-
 Ghana
-
 Greece
-
 Haiti
-
 Hong Kong
-
 Hungary
-
 India
-
 Indonesia
-
 Iran, Islamic republic
-
 Iraq
-
 Ireland
-
 Israel
-
 Italy
-
 Jamaica
-
 Japan
-
 Jordan
-
 Kazakhstan
-
 Kenya
-
 Korea
-
 Kuwait
-
 Kyrgyzstan
-
 Laos
-
 Latvia
-
 Lebanon
-
 Lesotho
-
 Libya
-
 Lithuania
-
 Luxembourg
-
 Madagascar
-
 Malaysia
-
 Malta
-
 Mauritius
-
 Mexico
-
 Moldova
-
 Mongolia
-
 Montenegro
-
 Morocco
-
 Mozambique
-
 Myanmar
-
 Namibia
-
 Nepal
-
 Netherlands
-
 New Zealand
-
 Nigeria
-
 North Macedonia
-
 Norway
-
 Oman
-
 Pakistan
-
 Palestine
-
 Panama
-
 Papua New Guinea
-
 Paraguay
-
 Peru
-
 Philippines
-
 Poland
-
 Portugal
-
 Puerto Rico
-
 Qatar
-
 Reunion
-
 Romania
-
 Rwanda
-
 Saudi Arabia
-
 Serbia
-
 Singapore
-
 Slovakia
-
 Slovenia
-
 Somalia
-
 South Africa
-
 Spain
-
 Sri Lanka
-
 Sweden
-
 Switzerland
-
 Syria
-
 Taiwan
-
 Tajikistan
-
 Tanzania
-
 Thailand
-
 Trinidad and Tobago
-
 Tunisia
-
 Turkey
-
 UAE
-
 Uganda
-
 Ukraine
-
 United Kingdom
-
United States
-
 Uruguay
-
 Uzbekistan
-
 Venezuela
-
 Vietnam
-
 Yemen
-
 Zambia
-
 Zimbabwe
- Forex
- Crypto












