

RAY climbs more than 11% after strong Q3 earnings and buyback program

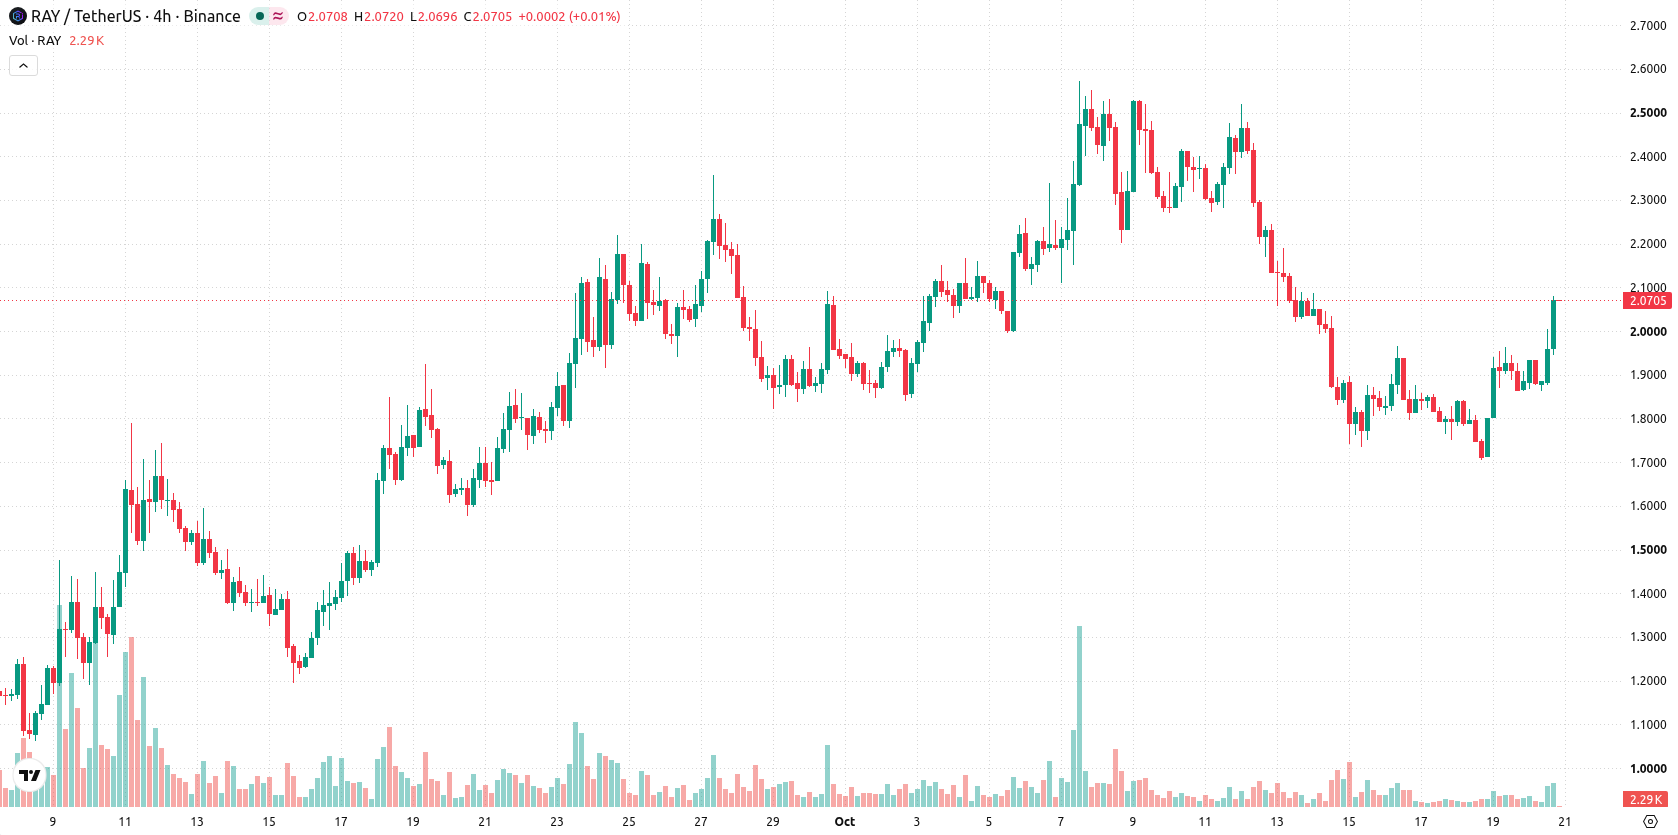
Raydium (RAY) jumped 11.01% after reporting a surge in trading fees and a significant token buyback program in Q3 2026, driving investor demand. The move is supported by bullish medium- and long-term trend signals, with prices holding above the 50- and 200-day moving averages even as the 20-day average acts as the near-term ceiling.
 1.4275
1.8135
Highlights
- Raydium trading fees surged to $57.1 million in Q3 2026, tripling year-over-year as platform activity increased.
- Twelve percent of quarterly fees funded buybacks of 4.58 million RAY tokens, and Total Value Locked rose 56% to $1.34 billion.
- RAY/USD trades below near-term resistance at $2.0698 with mixed momentum signals and a projected five-day range of $1.6662 to $2.2606.
Fee surge and buybacks fuel rally after StonkFun migration
Raydium, a decentralized exchange on the Solana network, reported that trading fees tripled year-over-year in Q3 2026 to $57.1 million, with 12% of these fees allocated to buy back 4.58 million RAY tokens and reduce the circulating supply. The Total Value Locked on the platform increased 56% to $1.34 billion, supported by strong September trading volumes after the migration of StonkFun's launchpad to Raydium's infrastructure. Over $5.15 million was used for buybacks during the quarter.
Bullish trend foundation as momentum signals show mixed bias
RAY/USD is trading just below the 20-day moving average at $2.0698, but remains above the 50-day ($1.7163) and 200-day ($0.9406) moving averages, highlighting a bullish foundation for both the medium- and long-term trends. The near-term ceiling is set at $2.0698, with the nearest support at $1.8636, and upside structure reinforced by the MA-50 above MA-200 alignment. Resistance sits at the Ichimoku Kijun ($2.1386). Momentum signals are mixed, with MACD neutral and ADX indicating trend continuity. RSI stands at 46.98, signaling a sell, while the Stochastic RSI enters oversold territory at 10.54. CCI and BBP reflect intraday seller dominance, as confirmed by a negative Awesome Oscillator.
In a recent review, analysts highlighted that Raydium's rapid trading fee growth and active token buybacks were supporting a bullish technical outlook. The current article adds stronger evidence with updated Q3 data and a larger buyback, while the trading setup now favors close monitoring of the $2.0698 resistance and $1.6662 support as volatility persists.









-
 Afghanistan
-
 Albania
-
 Algeria
-
 Angola
-
 Argentina
-
 Armenia
-
 Australia
-
 Austria
-
 Azerbaijan
-
 Bahamas
-
 Bahrain
-
 Bangladesh
-
 Belarus
-
 Belgium
-
 Bolivia
-
 Botswana
-
 Brazil
-
 Brunei
-
 Bulgaria
-
 Cambodia
-
 Cameroon
-
 Canada
-
 Chile
-
 China
-
 Colombia
-
 Congo
-
 Costa Rica
-
 Cote d'Ivoire
-
 Croatia
-
 Cuba
-
 Cyprus
-
 Czechia
-
 DR Congo
-
 Denmark
-
 Dominican Republic
-
 Ecuador
-
 Egypt
-
 El Salvador
-
 Estonia
-
 Eswatini
-
 Ethiopia
-
 Finland
-
 France
-
 Georgia
-
 Germany
-
 Ghana
-
 Greece
-
 Haiti
-
 Hong Kong
-
 Hungary
-
 India
-
 Indonesia
-
 Iran, Islamic republic
-
 Iraq
-
 Ireland
-
 Israel
-
 Italy
-
 Jamaica
-
 Japan
-
 Jordan
-
 Kazakhstan
-
 Kenya
-
 Korea
-
 Kuwait
-
 Kyrgyzstan
-
 Laos
-
 Latvia
-
 Lebanon
-
 Lesotho
-
 Libya
-
 Lithuania
-
 Luxembourg
-
 Madagascar
-
 Malaysia
-
 Malta
-
 Mauritius
-
 Mexico
-
 Moldova
-
 Mongolia
-
 Montenegro
-
 Morocco
-
 Mozambique
-
 Myanmar
-
 Namibia
-
 Nepal
-
 Netherlands
-
 New Zealand
-
 Nigeria
-
 North Macedonia
-
 Norway
-
 Oman
-
 Pakistan
-
 Palestine
-
 Panama
-
 Papua New Guinea
-
 Paraguay
-
 Peru
-
 Philippines
-
 Poland
-
 Portugal
-
 Puerto Rico
-
 Qatar
-
 Reunion
-
 Romania
-
 Rwanda
-
 Saudi Arabia
-
 Serbia
-
 Singapore
-
 Slovakia
-
 Slovenia
-
 Somalia
-
 South Africa
-
 Spain
-
 Sri Lanka
-
 Sweden
-
 Switzerland
-
 Syria
-
 Taiwan
-
 Tajikistan
-
 Tanzania
-
 Thailand
-
 Trinidad and Tobago
-
 Tunisia
-
 Turkey
-
 UAE
-
 Uganda
-
 Ukraine
-
 United Kingdom
-
United States
-
 Uruguay
-
 Uzbekistan
-
 Venezuela
-
 Vietnam
-
 Yemen
-
 Zambia
-
 Zimbabwe
- Forex
- Crypto












