

RPL climbs as upward price move accelerates

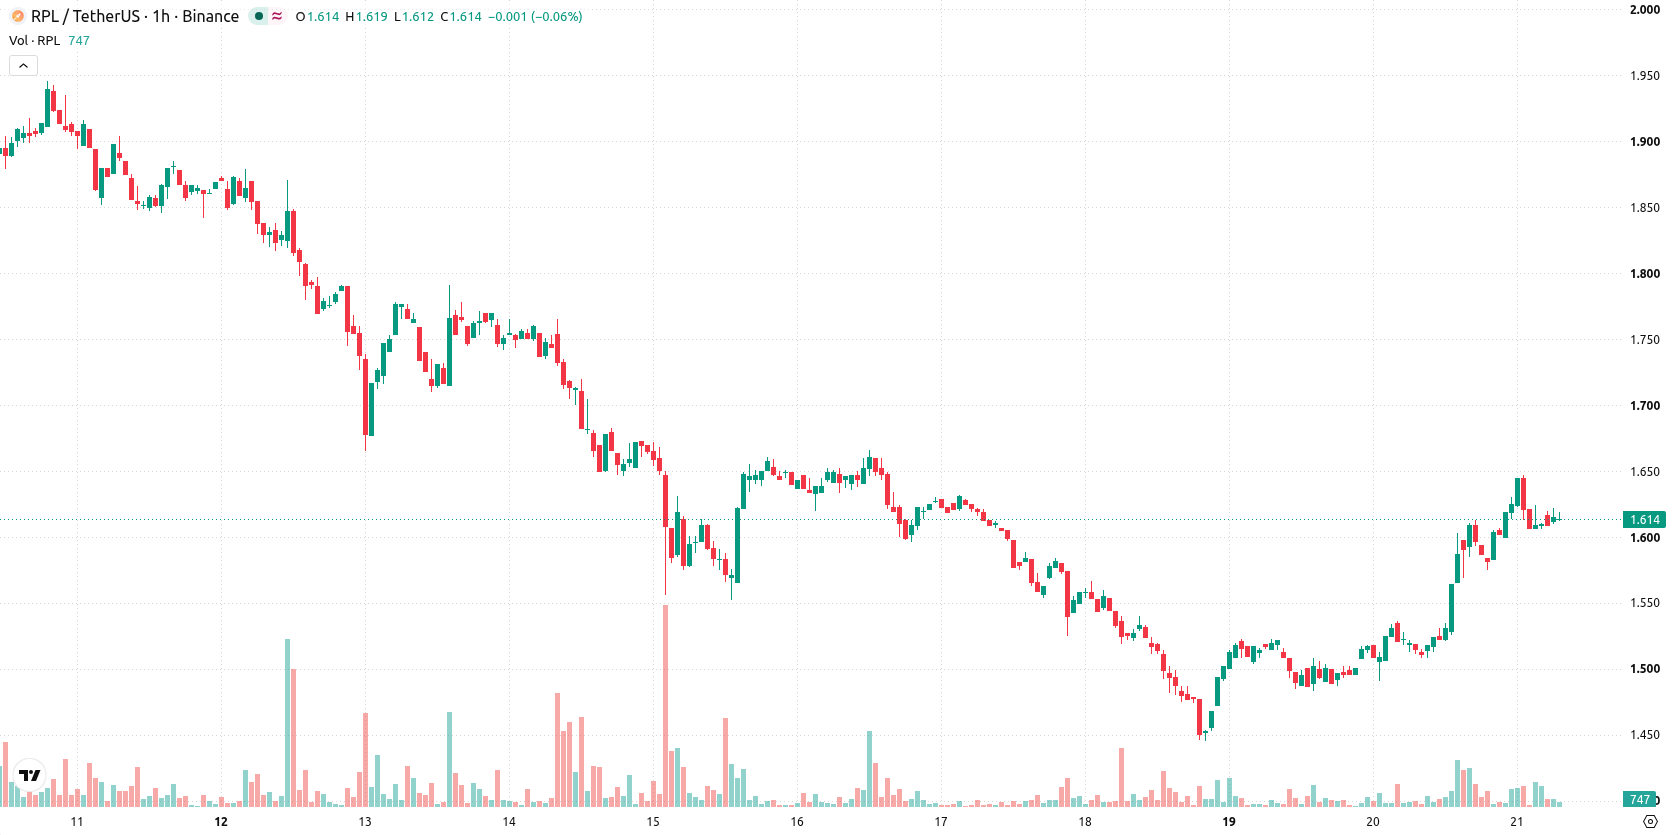
Rocket Pool (RPL) is trading at $1.618 after a daily move up of 7.08%. The asset sits above its key moving averages.
 1.502
1.5410
Highlights
- RPL/USD trades above short- and medium-term moving averages but remains below its long-term trend indicator.
- Key momentum signals including MACD and ADX indicate bullish conditions, while oscillators diverge and suggest possible short-term pullback.
- The expected price range over the next 2 to 3 trading days is $1.518 to $1.6688, with upside probability very high and downside risk considered very low.
Bullish momentum persists as oscillator signals diverge
On the h1 timeframe, RPL/USD is trading above the MA-20 at $1.5967 and the MA-50 at $1.544, while it remains below the MA-200 at $1.6937 on the daily timeframe. Immediate support is located at the daily Ichimoku Kijun of $1.5775. MACD and ADX both issue a buy signal, CCI is bullish, and RSI is at 62, indicating positive momentum without approaching overbought levels. Stochastic RSI is in oversold territory, warning of a potential short-term pullback, while Bull/Bear Power signals sustained buyer dominance on an intraday basis. The Awesome Oscillator is neutral. A divergence exists among oscillators, as Stoch RSI divergence contrasts with the momentum indicators' bullish signals.
Upward breakout favored as sideways trade persists
Over the next 2–3 trading days, price is expected to fluctuate within the $1.518 to $1.6688 range. The probability of an upward move is very high, while a downside break is viewed as much less likely. The baseline scenario sees RPL/USD moving sideways within this corridor; a bullish breakout above resistance would shift focus to the upper boundary, whereas a move below support could expose the lower end of the forecast band.
Previously it was reported that Rocket Pool had transitioned from persistent bearish momentum to a period of short-term bullish consolidation. The latest analysis indicates that this positive momentum persists and highlights the importance of monitoring the $1.5775 support level, as a decisive move below it could reveal new downside risks.











-
 Afghanistan
-
 Albania
-
 Algeria
-
 Angola
-
 Argentina
-
 Armenia
-
 Australia
-
 Austria
-
 Azerbaijan
-
 Bahamas
-
 Bahrain
-
 Bangladesh
-
 Belarus
-
 Belgium
-
 Bolivia
-
 Botswana
-
 Brazil
-
 Brunei
-
 Bulgaria
-
 Cambodia
-
 Cameroon
-
 Canada
-
 Chile
-
 China
-
 Colombia
-
 Congo
-
 Costa Rica
-
 Cote d'Ivoire
-
 Croatia
-
 Cuba
-
 Cyprus
-
 Czechia
-
 DR Congo
-
 Denmark
-
 Dominican Republic
-
 Ecuador
-
 Egypt
-
 El Salvador
-
 Estonia
-
 Eswatini
-
 Ethiopia
-
 Finland
-
 France
-
 Georgia
-
 Germany
-
 Ghana
-
 Greece
-
 Haiti
-
 Hong Kong
-
 Hungary
-
 India
-
 Indonesia
-
 Iran, Islamic republic
-
 Iraq
-
 Ireland
-
 Israel
-
 Italy
-
 Jamaica
-
 Japan
-
 Jordan
-
 Kazakhstan
-
 Kenya
-
 Korea
-
 Kuwait
-
 Kyrgyzstan
-
 Laos
-
 Latvia
-
 Lebanon
-
 Lesotho
-
 Libya
-
 Lithuania
-
 Luxembourg
-
 Madagascar
-
 Malaysia
-
 Malta
-
 Mauritius
-
 Mexico
-
 Moldova
-
 Mongolia
-
 Montenegro
-
 Morocco
-
 Mozambique
-
 Myanmar
-
 Namibia
-
 Nepal
-
 Netherlands
-
 New Zealand
-
 Nigeria
-
 North Macedonia
-
 Norway
-
 Oman
-
 Pakistan
-
 Palestine
-
 Panama
-
 Papua New Guinea
-
 Paraguay
-
 Peru
-
 Philippines
-
 Poland
-
 Portugal
-
 Puerto Rico
-
 Qatar
-
 Reunion
-
 Romania
-
 Rwanda
-
 Saudi Arabia
-
 Serbia
-
 Singapore
-
 Slovakia
-
 Slovenia
-
 Somalia
-
 South Africa
-
 Spain
-
 Sri Lanka
-
 Sweden
-
 Switzerland
-
 Syria
-
 Taiwan
-
 Tajikistan
-
 Tanzania
-
 Thailand
-
 Trinidad and Tobago
-
 Tunisia
-
 Turkey
-
 UAE
-
 Uganda
-
 Ukraine
-
 United Kingdom
-
United States
-
 Uruguay
-
 Uzbekistan
-
 Venezuela
-
 Vietnam
-
 Yemen
-
 Zambia
-
 Zimbabwe
- Forex
- Crypto












