

Ethereum weekly outlook: Can ETH overcome bearish momentum with MACD signaling further downside?

Ethereum (ETH) hovered near $2,450 after slipping around 1.5% over the past week, as renewed concerns around institutional flows pressured sentiment. Continued outflows from U.S. spot ETFs have tested bulls’ resolve, setting the tone for a cautious start to the coming week with resistance levels in focus.
 2276.31
2391.55
Highlights
- Ethereum trades at $2,452 after a $39.4 decrease over 7 days, holding below short-term moving averages.
- Technical structure remains bearish with ongoing negative momentum and an ADX reading consistent with a sell trend.
- Expected price range for the coming week is $2,359 to $2,560, with resistance at $2,494 and support at $2,318.
Ongoing U.S. ETF withdrawals balanced by record staking and Glamsterdam upgrade
U.S. spot Ethereum ETFs saw significant net outflows, with $26.13 million withdrawn on October 20 and a weekly total of $320.1 million, according to TokenPost and CryptoTicker. Despite 15 straight sessions of ETF outflows, the asset consistently maintained support, as highlighted by FXStreet and Invezz. Meanwhile, Ethereum staking reached a new high, and the upcoming 'Glamsterdam' upgrade is set for activation on the Hoodi testnet on October 26 according to Coinpaper and TokenPost, marking ongoing network development momentum (source: FXStreet).
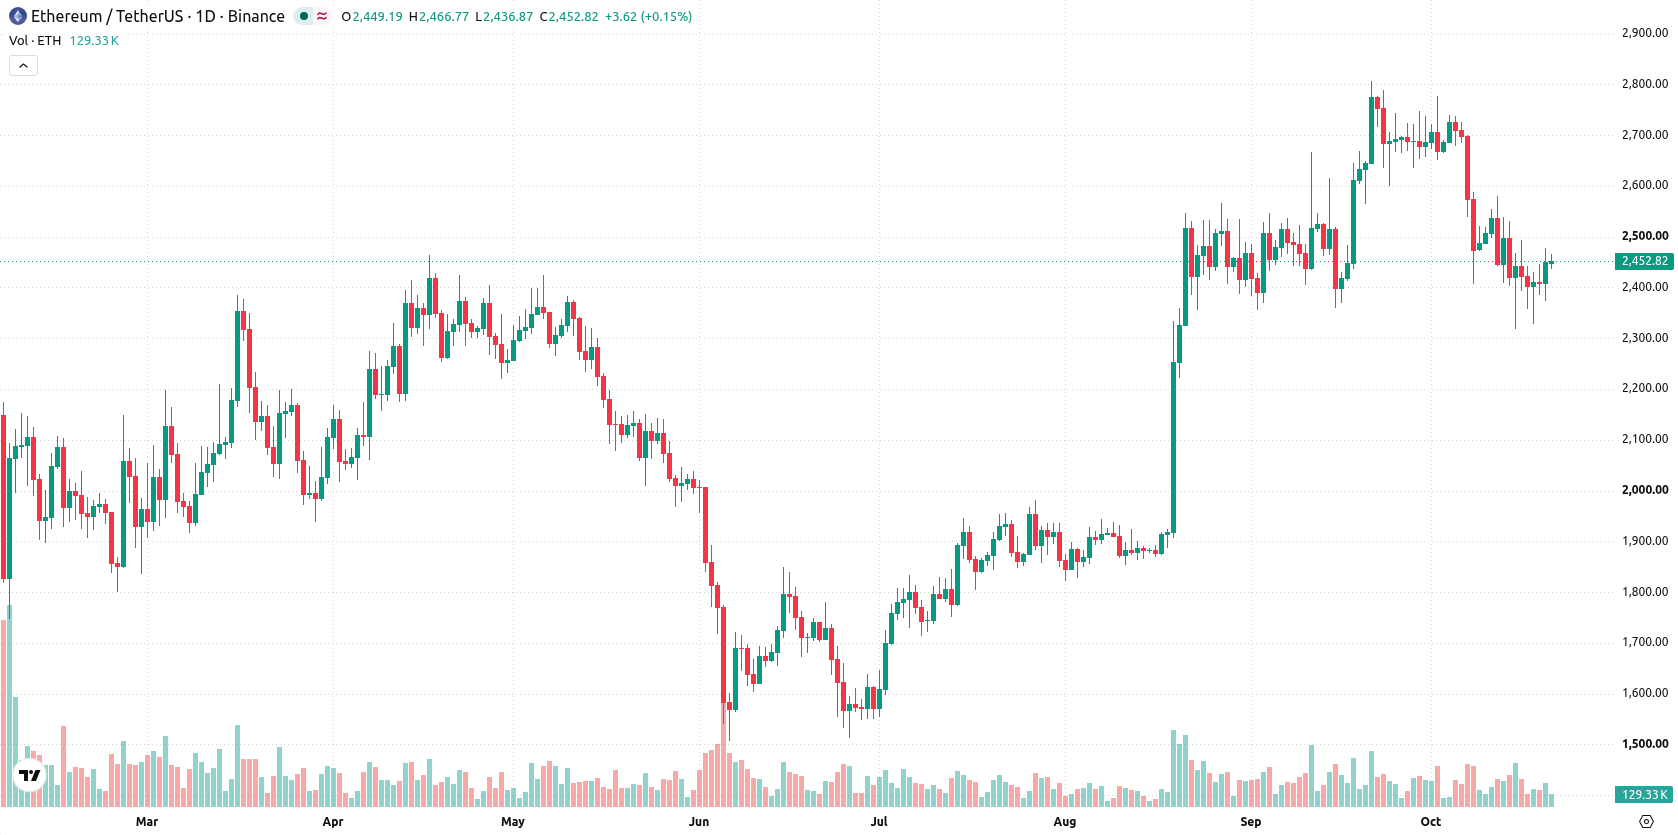
MACD-led bearish momentum intensifies as price holds near weekly support
The daily chart reveals a sustained move lower with a firm trend, underscored by a 7.59% volatility over the past week. MACD signals ongoing bearish momentum, while ADX at 29.31 also points to a sell trend. Support is marked at $2,318 and resistance at $2,494, with the Ichimoku Kijun at $2,547 serving as an additional resistance zone. With price action holding in the upper part of the weekly range, short-term bearish momentum is in focus.
Range-trading bias dominates with breakout risks near resistance next week
In the week ahead, Ethereum is expected to trade between $2,359 and $2,560. There is a 45% probability of an increase and a 55% probability of a decrease. Base case sees further range-trading below resistance at $2,494. A bullish scenario emerges only with a clear move above $2,494 and $2,547, while a drop below $2,318 would confirm renewed downside pressure.
Earlier, analysts noted that Ethereum’s price maintained technical resilience and a constructive outlook amid record staking levels and sustained protocol upgrades, even as ETF outflows persisted. The current analysis adds a more cautious dimension, highlighting that with bearish momentum building, traders should monitor the $2,494 resistance for signals of a trend reversal or renewed downside if $2,318 is breached.






Latest Ethereum News





-
 Afghanistan
-
 Albania
-
 Algeria
-
 Angola
-
 Argentina
-
 Armenia
-
 Australia
-
 Austria
-
 Azerbaijan
-
 Bahamas
-
 Bahrain
-
 Bangladesh
-
 Belarus
-
 Belgium
-
 Bolivia
-
 Botswana
-
 Brazil
-
 Brunei
-
 Bulgaria
-
 Cambodia
-
 Cameroon
-
 Canada
-
 Chile
-
 China
-
 Colombia
-
 Congo
-
 Costa Rica
-
 Cote d'Ivoire
-
 Croatia
-
 Cuba
-
 Cyprus
-
 Czechia
-
 DR Congo
-
 Denmark
-
 Dominican Republic
-
 Ecuador
-
 Egypt
-
 El Salvador
-
 Estonia
-
 Eswatini
-
 Ethiopia
-
 Finland
-
 France
-
 Georgia
-
 Germany
-
 Ghana
-
 Greece
-
 Haiti
-
 Hong Kong
-
 Hungary
-
 India
-
 Indonesia
-
 Iran, Islamic republic
-
 Iraq
-
 Ireland
-
 Israel
-
 Italy
-
 Jamaica
-
 Japan
-
 Jordan
-
 Kazakhstan
-
 Kenya
-
 Korea
-
 Kuwait
-
 Kyrgyzstan
-
 Laos
-
 Latvia
-
 Lebanon
-
 Lesotho
-
 Libya
-
 Lithuania
-
 Luxembourg
-
 Madagascar
-
 Malaysia
-
 Malta
-
 Mauritius
-
 Mexico
-
 Moldova
-
 Mongolia
-
 Montenegro
-
 Morocco
-
 Mozambique
-
 Myanmar
-
 Namibia
-
 Nepal
-
 Netherlands
-
 New Zealand
-
 Nigeria
-
 North Macedonia
-
 Norway
-
 Oman
-
 Pakistan
-
 Palestine
-
 Panama
-
 Papua New Guinea
-
 Paraguay
-
 Peru
-
 Philippines
-
 Poland
-
 Portugal
-
 Puerto Rico
-
 Qatar
-
 Reunion
-
 Romania
-
 Rwanda
-
 Saudi Arabia
-
 Serbia
-
 Singapore
-
 Slovakia
-
 Slovenia
-
 Somalia
-
 South Africa
-
 Spain
-
 Sri Lanka
-
 Sweden
-
 Switzerland
-
 Syria
-
 Taiwan
-
 Tajikistan
-
 Tanzania
-
 Thailand
-
 Trinidad and Tobago
-
 Tunisia
-
 Turkey
-
 UAE
-
 Uganda
-
 Ukraine
-
 United Kingdom
-
United States
-
 Uruguay
-
 Uzbekistan
-
 Venezuela
-
 Vietnam
-
 Yemen
-
 Zambia
-
 Zimbabwe
- Forex
- Crypto












