

SUI declines as sellers dominate the short-term price trend

Sui (SUI) is trading at $0.9747 after a sharp daily decline of 7.54%. The asset is currently situated below its primary short- and medium-term moving averages but remains above its longer-term average.
 0.7299
0.8290
Highlights
- Sui announced partnerships with Alibaba Cloud, Samsung Wallet, and Circle's CCTP V2, plus AI agent payments and gasless stablecoin transactions to expand protocol capabilities.
- The Sui Foundation invested $30 million to support the DATA Network's migration and token swap, deepening developer and ecosystem engagement.
- SUI trades below key short- and medium-term averages, with technical indicators confirming strong downside momentum and an expected range of $0.9469 to $1.0188 over the next 2 to 3 days.
Ecosystem expansion via major partnerships amid sustained price pressure
At the Sui Basecamp 2026 event in Singapore on October 7–8, Sui announced partnerships with Alibaba Cloud, Samsung Wallet, and Circle's CCTP V2, alongside releases of AI-driven agent payments and gasless stablecoin transactions, according to Kucoin. These developments are expected to broaden Sui's ecosystem capabilities and signal project maturation, especially with the addition of gasless stablecoin functionality. The Sui Foundation's $30 million investment to support the DATA Network’s migration and token swap, reported by Tokenpost, further expands developer engagement and network activity for the protocol, while anticipation of the Samsung Wallet integration and new AI infrastructure, noted by Altcoinbuzz, highlights incremental ecosystem growth, though price action has remained under broader selling pressure.
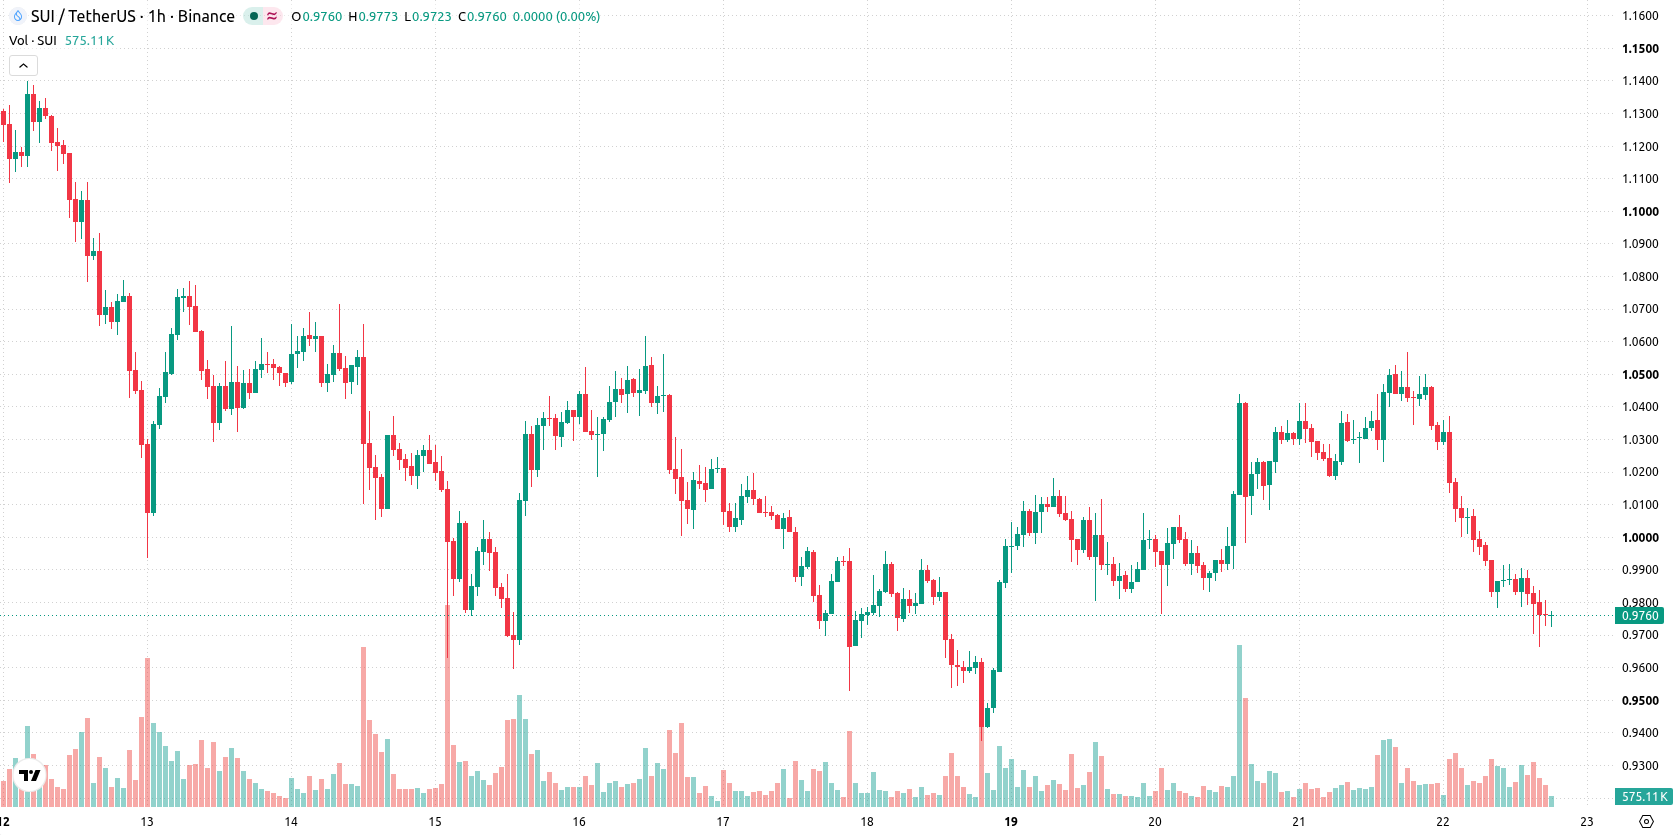
Downside momentum persists with negative signals and key supports intact
On the technical front, SUI/USD is trading below the MA-20 at $0.9975 and MA-50 at $1.0186, but remains above the MA-200 at $0.8654. Immediate resistance is defined by the Ichimoku Kijun at $1.0114, with support emerging from the long-term average. Momentum indicators such as MACD, ADX, and the Awesome Oscillator all show negative readings, signaling a prevalent downside trend. RSI, CCI, and Stoch RSI are in sell or oversold territory, while Bull/Bear Power confirms sellers continue to control intraday moves.
Volatility expected to stay high as downside scenario dominates
In the near term, volatility is likely to remain elevated, with an expected trading range between $0.9469 and $1.0188 over the coming 2–3 sessions. The prevailing scenario favors a continuation of the downside, as the probability of an upside reversal remains extremely low. A move above $1.0114 would open the door for resistance breakouts, while a sustained drop below $0.9469 may accelerate selling momentum. Overall, the baseline case calls for traded prices to remain volatile within this corridor.
Previously it was reported that the Sui Foundation committed $30 million to support the DATA Network’s migration, marking a strategic collaboration focused on AI data infrastructure. The current technical setup reinforces downside risk, with heightened volatility and an active trading range between $0.9469 and $1.0188 presenting key levels for market participants to monitor in the coming sessions.










-
 Afghanistan
-
 Albania
-
 Algeria
-
 Angola
-
 Argentina
-
 Armenia
-
 Australia
-
 Austria
-
 Azerbaijan
-
 Bahamas
-
 Bahrain
-
 Bangladesh
-
 Belarus
-
 Belgium
-
 Bolivia
-
 Botswana
-
 Brazil
-
 Brunei
-
 Bulgaria
-
 Cambodia
-
 Cameroon
-
 Canada
-
 Chile
-
 China
-
 Colombia
-
 Congo
-
 Costa Rica
-
 Cote d'Ivoire
-
 Croatia
-
 Cuba
-
 Cyprus
-
 Czechia
-
 DR Congo
-
 Denmark
-
 Dominican Republic
-
 Ecuador
-
 Egypt
-
 El Salvador
-
 Estonia
-
 Eswatini
-
 Ethiopia
-
 Finland
-
 France
-
 Georgia
-
 Germany
-
 Ghana
-
 Greece
-
 Haiti
-
 Hong Kong
-
 Hungary
-
 India
-
 Indonesia
-
 Iran, Islamic republic
-
 Iraq
-
 Ireland
-
 Israel
-
 Italy
-
 Jamaica
-
 Japan
-
 Jordan
-
 Kazakhstan
-
 Kenya
-
 Korea
-
 Kuwait
-
 Kyrgyzstan
-
 Laos
-
 Latvia
-
 Lebanon
-
 Lesotho
-
 Libya
-
 Lithuania
-
 Luxembourg
-
 Madagascar
-
 Malaysia
-
 Malta
-
 Mauritius
-
 Mexico
-
 Moldova
-
 Mongolia
-
 Montenegro
-
 Morocco
-
 Mozambique
-
 Myanmar
-
 Namibia
-
 Nepal
-
 Netherlands
-
 New Zealand
-
 Nigeria
-
 North Macedonia
-
 Norway
-
 Oman
-
 Pakistan
-
 Palestine
-
 Panama
-
 Papua New Guinea
-
 Paraguay
-
 Peru
-
 Philippines
-
 Poland
-
 Portugal
-
 Puerto Rico
-
 Qatar
-
 Reunion
-
 Romania
-
 Rwanda
-
 Saudi Arabia
-
 Serbia
-
 Singapore
-
 Slovakia
-
 Slovenia
-
 Somalia
-
 South Africa
-
 Spain
-
 Sri Lanka
-
 Sweden
-
 Switzerland
-
 Syria
-
 Taiwan
-
 Tajikistan
-
 Tanzania
-
 Thailand
-
 Trinidad and Tobago
-
 Tunisia
-
 Turkey
-
 UAE
-
 Uganda
-
 Ukraine
-
 United Kingdom
-
United States
-
 Uruguay
-
 Uzbekistan
-
 Venezuela
-
 Vietnam
-
 Yemen
-
 Zambia
-
 Zimbabwe
- Forex
- Crypto












