

Pendle technical analysis: Downward price move signals persistent bearish momentum

Pendle (PENDLE) is trading at $1.93, down 7.92% on the day. The price is currently positioned below its short- and medium-term moving averages, with long-term support still holding.
 1.455
1.5630
Highlights
- Pendle introduced PendleLoop, enabling users to take long positions on tokenized stocks by integrating with Aave markets.
- The integration expands Pendle's decentralized finance strategies and participant base, though price action remains under broad selling pressure.
- PENDLE trades below key moving averages with multiple momentum indicators showing strong bearish signals and a projected range of $1.865 to $1.997 for the next 2 to 3 days.
Protocol expansion with PendleLoop fails to offset selling pressure
Pendle has launched PendleLoop, a feature that allows users to take long positions on tokenized stocks using Aave markets, according to Coinfomania. This integration broadens Pendle's decentralized finance capabilities, giving the protocol access to a wider base of trading strategies and participants. While the addition enhances the platform's utility and may support future engagement, price action has remained under broader selling pressure.
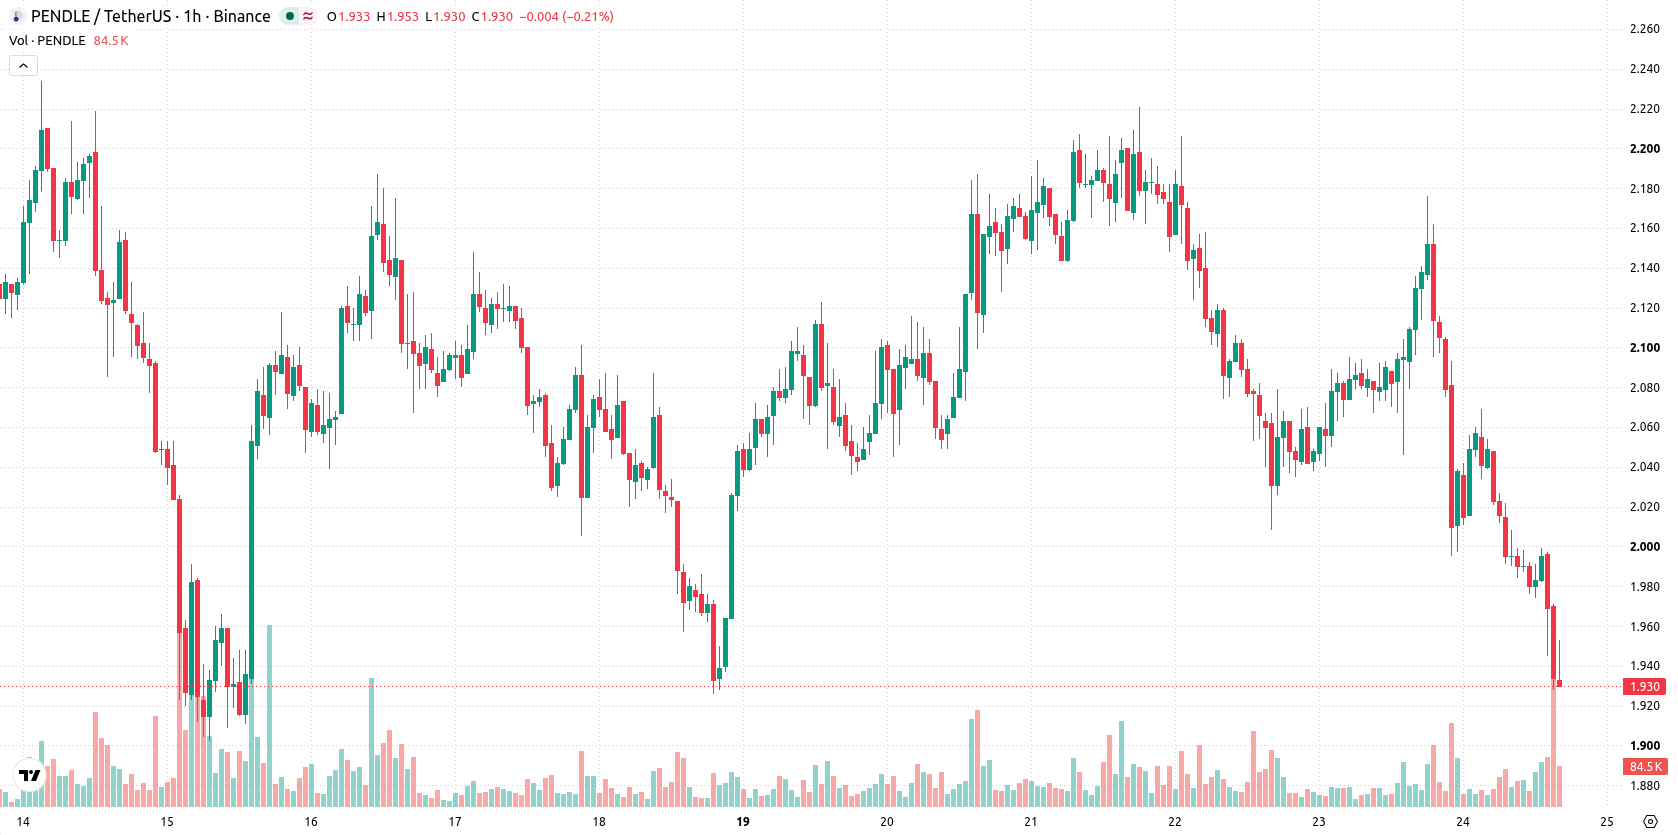
Bearish signals persist as key resistance rejects upside momentum
On the H1 timeframe, PENDLE is trading below the MA-20 at $2.01 and the MA-50 at $2.05, but remains above the MA-200 at $1.68. Immediate resistance is defined by the Ichimoku Kijun at $2.06, with short-term support seen near $1.87. MACD and ADX both indicate Sell signals, while Bull/Bear Power reflects continued seller dominance intraday. RSI is at 31.24 and CCI is in oversold territory, with Stoch RSI confirming oversold conditions. The Awesome Oscillator further supports ongoing downside momentum, indicating persistent bearish momentum but signaling possible short-term exhaustion.
Rebound risks fade as immediate support faces breakdown threat
Over the next 2 to 3 trading days, PENDLE is expected to trade within a volatility band between $1.87 and $1.99. The probability of a meaningful rebound is considered low, while the likelihood of further downside is elevated, particularly if support near $1.87 fails. A bullish scenario would require a sustained break above $2.06, while a bearish continuation could see the price accelerate lower if intraday support is breached.
Earlier, analysts noted that Pendle was exhibiting strong upward momentum, fueled by major DeFi integrations and increased adoption. The current decline below key moving averages and the build-up of selling pressure marks a shift in technical posture, making the $1.87 support level critical for traders monitoring downside risk.










-
 Afghanistan
-
 Albania
-
 Algeria
-
 Angola
-
 Argentina
-
 Armenia
-
 Australia
-
 Austria
-
 Azerbaijan
-
 Bahamas
-
 Bahrain
-
 Bangladesh
-
 Belarus
-
 Belgium
-
 Bolivia
-
 Botswana
-
 Brazil
-
 Brunei
-
 Bulgaria
-
 Cambodia
-
 Cameroon
-
 Canada
-
 Chile
-
 China
-
 Colombia
-
 Congo
-
 Costa Rica
-
 Cote d'Ivoire
-
 Croatia
-
 Cuba
-
 Cyprus
-
 Czechia
-
 DR Congo
-
 Denmark
-
 Dominican Republic
-
 Ecuador
-
 Egypt
-
 El Salvador
-
 Estonia
-
 Eswatini
-
 Ethiopia
-
 Finland
-
 France
-
 Georgia
-
 Germany
-
 Ghana
-
 Greece
-
 Haiti
-
 Hong Kong
-
 Hungary
-
 India
-
 Indonesia
-
 Iran, Islamic republic
-
 Iraq
-
 Ireland
-
 Israel
-
 Italy
-
 Jamaica
-
 Japan
-
 Jordan
-
 Kazakhstan
-
 Kenya
-
 Korea
-
 Kuwait
-
 Kyrgyzstan
-
 Laos
-
 Latvia
-
 Lebanon
-
 Lesotho
-
 Libya
-
 Lithuania
-
 Luxembourg
-
 Madagascar
-
 Malaysia
-
 Malta
-
 Mauritius
-
 Mexico
-
 Moldova
-
 Mongolia
-
 Montenegro
-
 Morocco
-
 Mozambique
-
 Myanmar
-
 Namibia
-
 Nepal
-
 Netherlands
-
 New Zealand
-
 Nigeria
-
 North Macedonia
-
 Norway
-
 Oman
-
 Pakistan
-
 Palestine
-
 Panama
-
 Papua New Guinea
-
 Paraguay
-
 Peru
-
 Philippines
-
 Poland
-
 Portugal
-
 Puerto Rico
-
 Qatar
-
 Reunion
-
 Romania
-
 Rwanda
-
 Saudi Arabia
-
 Serbia
-
 Singapore
-
 Slovakia
-
 Slovenia
-
 Somalia
-
 South Africa
-
 Spain
-
 Sri Lanka
-
 Sweden
-
 Switzerland
-
 Syria
-
 Taiwan
-
 Tajikistan
-
 Tanzania
-
 Thailand
-
 Trinidad and Tobago
-
 Tunisia
-
 Turkey
-
 UAE
-
 Uganda
-
 Ukraine
-
 United Kingdom
-
United States
-
 Uruguay
-
 Uzbekistan
-
 Venezuela
-
 Vietnam
-
 Yemen
-
 Zambia
-
 Zimbabwe
- Forex
- Crypto












