

Will Walrus see a reversal as seller pressure limits upside?

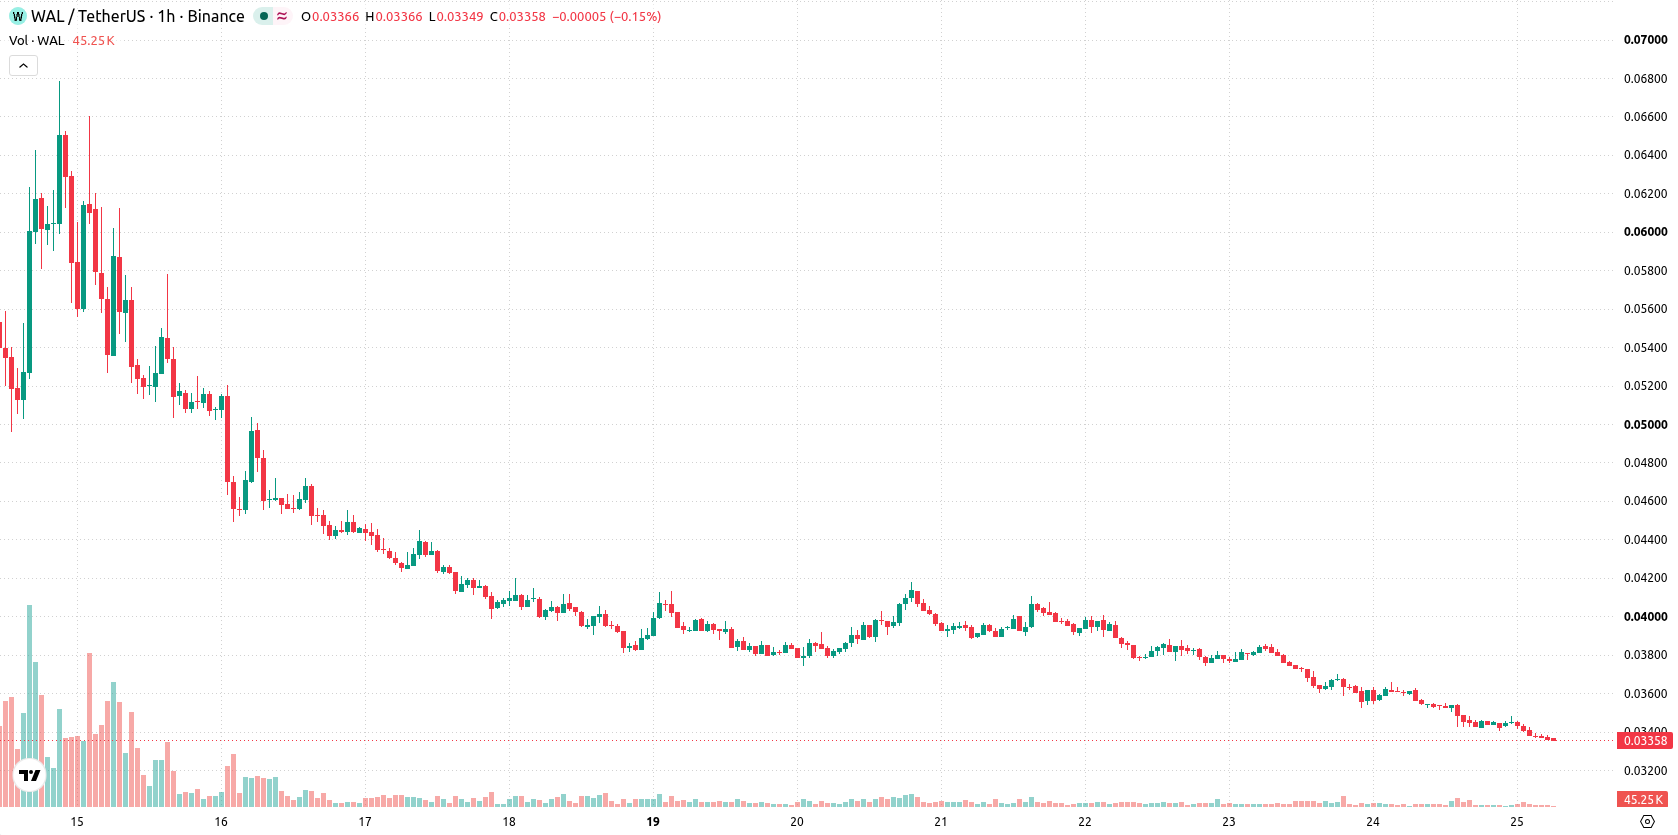
Walrus (WAL) is trading at $0.0335 after falling 7.04% today. The price remains below its key moving averages, suggesting continued seller pressure and a negative bias in the short term.
 0.0223
0.0250
Highlights
- WAL/USD trades below key moving averages across hourly and daily timeframes, maintaining a bearish technical structure.
- Momentum indicators such as MACD, ADX, and CCI confirm persistent weakness, with the asset in an oversold condition.
- For the next 2 to 3 trading days, the expected price range is $0.0318 to $0.0352, with a high probability of further downside.
Oversold conditions deepen as sellers defend technical resistance
WAL is trading below the MA-20 ($0.0345) and MA-50 ($0.0358) on the hourly timeframe, along with the MA-200 ($0.0422) on the daily chart. The Ichimoku Kijun at $0.035 acts as immediate resistance. Momentum indicators remain weak: MACD and ADX issue Sell signals, RSI is oversold at 25.31, and CCI is also oversold, while Stoch RSI is Neutral and Bull/Bear Power is negative. The Awesome Oscillator confirms seller dominance, and price is holding near the session low after opening with a negative gap of 0.0015, reflecting moderate volatility and confirming a pessimistic momentum profile.
Lower probability of upside as price remains near support
Over the next 2–3 trading days, WAL is expected to fluctuate within a typical volatility band of $0.0318 to $0.0352. There is a very low probability of an upward move in this period, while the chance of a downward move is high. The baseline scenario calls for sideways trading within this range; the bullish scenario would require a break above the $0.035 resistance, while breaching the $0.0318 support could expose further downside risk.
Earlier, analysts noted that Walrus was demonstrating persistent bearish momentum as it continued to trade beneath its major moving averages. The latest data reinforces this negative trend, highlighting the importance of monitoring the $0.0318 support level for any signs of further downside risk in the sessions ahead.










-
 Afghanistan
-
 Albania
-
 Algeria
-
 Angola
-
 Argentina
-
 Armenia
-
 Australia
-
 Austria
-
 Azerbaijan
-
 Bahamas
-
 Bahrain
-
 Bangladesh
-
 Belarus
-
 Belgium
-
 Bolivia
-
 Botswana
-
 Brazil
-
 Brunei
-
 Bulgaria
-
 Cambodia
-
 Cameroon
-
 Canada
-
 Chile
-
 China
-
 Colombia
-
 Congo
-
 Costa Rica
-
 Cote d'Ivoire
-
 Croatia
-
 Cuba
-
 Cyprus
-
 Czechia
-
 DR Congo
-
 Denmark
-
 Dominican Republic
-
 Ecuador
-
 Egypt
-
 El Salvador
-
 Estonia
-
 Eswatini
-
 Ethiopia
-
 Finland
-
 France
-
 Georgia
-
 Germany
-
 Ghana
-
 Greece
-
 Haiti
-
 Hong Kong
-
 Hungary
-
 India
-
 Indonesia
-
 Iran, Islamic republic
-
 Iraq
-
 Ireland
-
 Israel
-
 Italy
-
 Jamaica
-
 Japan
-
 Jordan
-
 Kazakhstan
-
 Kenya
-
 Korea
-
 Kuwait
-
 Kyrgyzstan
-
 Laos
-
 Latvia
-
 Lebanon
-
 Lesotho
-
 Libya
-
 Lithuania
-
 Luxembourg
-
 Madagascar
-
 Malaysia
-
 Malta
-
 Mauritius
-
 Mexico
-
 Moldova
-
 Mongolia
-
 Montenegro
-
 Morocco
-
 Mozambique
-
 Myanmar
-
 Namibia
-
 Nepal
-
 Netherlands
-
 New Zealand
-
 Nigeria
-
 North Macedonia
-
 Norway
-
 Oman
-
 Pakistan
-
 Palestine
-
 Panama
-
 Papua New Guinea
-
 Paraguay
-
 Peru
-
 Philippines
-
 Poland
-
 Portugal
-
 Puerto Rico
-
 Qatar
-
 Reunion
-
 Romania
-
 Rwanda
-
 Saudi Arabia
-
 Serbia
-
 Singapore
-
 Slovakia
-
 Slovenia
-
 Somalia
-
 South Africa
-
 Spain
-
 Sri Lanka
-
 Sweden
-
 Switzerland
-
 Syria
-
 Taiwan
-
 Tajikistan
-
 Tanzania
-
 Thailand
-
 Trinidad and Tobago
-
 Tunisia
-
 Turkey
-
 UAE
-
 Uganda
-
 Ukraine
-
 United Kingdom
-
United States
-
 Uruguay
-
 Uzbekistan
-
 Venezuela
-
 Vietnam
-
 Yemen
-
 Zambia
-
 Zimbabwe
- Forex
- Crypto












