

Bitcoin sees $773M in ETF outflows: BTC remains under pressure

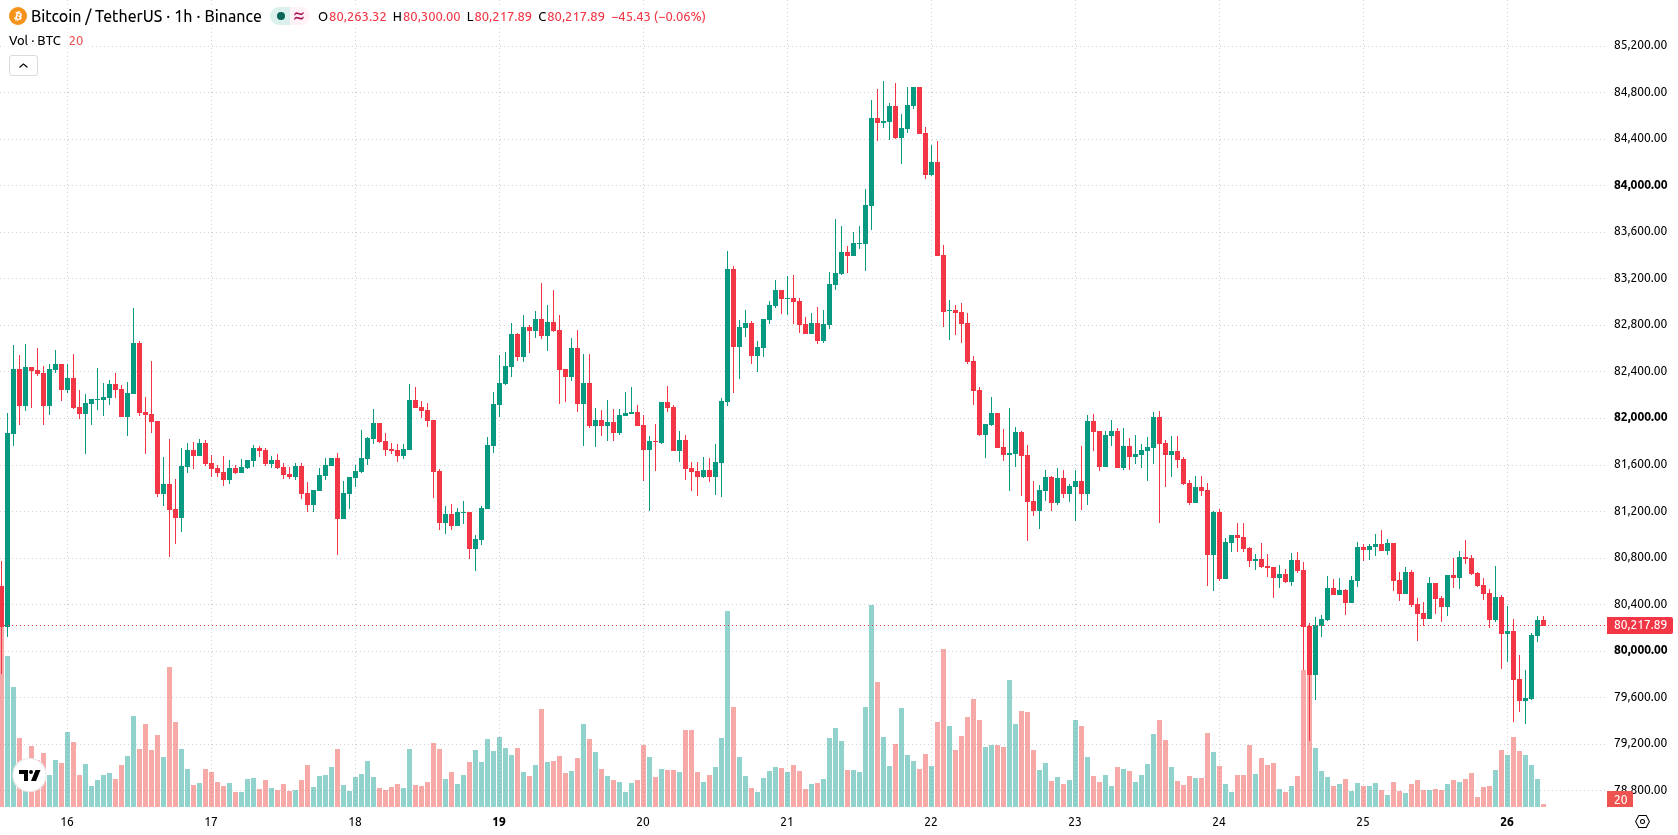
Bitcoin (BTC) is trading at $80,263 in today's session, registering a modest intraday decline. The price currently sits below its key short- and medium-term moving averages while holding above its main long-term average, indicating ongoing pressure from sellers yet retention of the overall bullish structure.
 77314.01
81971.00
Highlights
- U.S. spot Bitcoin ETFs saw outflows of $773.5 million over two sessions, reducing institutional spot demand and market liquidity.
- Despite recent withdrawals, the five-day net balance for spot Bitcoin ETFs remains positive at $301.2 million, showing aggregate positions are still intact.
- BTC/USD trades below key short-term averages with technical indicators signaling selling pressure, and a projected trading range of $78,993 to $81,532 over the next 2 to 3 days.
Institutional spot ETF outflows curb demand despite net-positive inflows
Recent data from Crypto shows that U.S. spot Bitcoin ETFs experienced significant outflows, with investors pulling approximately $773.5 million across the last two trading sessions. This withdrawal reduces institutional spot demand and can weigh on market liquidity, influencing price direction. However, the five-day balance for these ETFs remains positive by about $301.2 million, providing some counterbalance and indicating that aggregate positions have not fully unwound.
Downside momentum prevails as key support holds and indicators weaken
On the technical front, BTC is trading below its MA-20 at $80,326 and MA-50 at $80,508 on the one-hour chart, while remaining above its MA-200 at $72,989 on the daily timeframe. The Ichimoku Kijun level at $80,201 acts as immediate support for the current session. Among indicators, momentum readings are negative: both MACD and ADX flash sell signals, and RSI sits at 39.43, showing continued weakness. CCI and Bull/Bear Power are in oversold territory, hinting at prevailing downside, while Stochastic RSI signals a potential short-term buy, underscoring the possibility of a technical bounce against broader selling momentum.
Consolidation risks tilt toward downside within defined volatility range
Looking ahead, BTC is expected to trade within a typical volatility band of $78,993 to $81,532 over the next several sessions. Probabilities favor further downside movement at 59%, compared to a 41% chance for an upward reversal. The baseline scenario sees BTC consolidating within this corridor; a bullish breakout would require a clear move above resistance, while renewed selling could accelerate if price closes below support at $78,993.
Previously, analysts noted that Bitcoin ETF inflows had shown signs of stabilizing, but that pronounced market swings and leverage continued to pose risks to sustained upside. The latest data highlighting significant outflows from U.S. spot Bitcoin ETFs now adds renewed pressure to liquidity, making the $78,993 support level a critical threshold to watch for potential acceleration of downside momentum.






Latest Bitcoin News



-
 Afghanistan
-
 Albania
-
 Algeria
-
 Angola
-
 Argentina
-
 Armenia
-
 Australia
-
 Austria
-
 Azerbaijan
-
 Bahamas
-
 Bahrain
-
 Bangladesh
-
 Belarus
-
 Belgium
-
 Bolivia
-
 Botswana
-
 Brazil
-
 Brunei
-
 Bulgaria
-
 Cambodia
-
 Cameroon
-
 Canada
-
 Chile
-
 China
-
 Colombia
-
 Congo
-
 Costa Rica
-
 Cote d'Ivoire
-
 Croatia
-
 Cuba
-
 Cyprus
-
 Czechia
-
 DR Congo
-
 Denmark
-
 Dominican Republic
-
 Ecuador
-
 Egypt
-
 El Salvador
-
 Estonia
-
 Eswatini
-
 Ethiopia
-
 Finland
-
 France
-
 Georgia
-
 Germany
-
 Ghana
-
 Greece
-
 Haiti
-
 Hong Kong
-
 Hungary
-
 India
-
 Indonesia
-
 Iran, Islamic republic
-
 Iraq
-
 Ireland
-
 Israel
-
 Italy
-
 Jamaica
-
 Japan
-
 Jordan
-
 Kazakhstan
-
 Kenya
-
 Korea
-
 Kuwait
-
 Kyrgyzstan
-
 Laos
-
 Latvia
-
 Lebanon
-
 Lesotho
-
 Libya
-
 Lithuania
-
 Luxembourg
-
 Madagascar
-
 Malaysia
-
 Malta
-
 Mauritius
-
 Mexico
-
 Moldova
-
 Mongolia
-
 Montenegro
-
 Morocco
-
 Mozambique
-
 Myanmar
-
 Namibia
-
 Nepal
-
 Netherlands
-
 New Zealand
-
 Nigeria
-
 North Macedonia
-
 Norway
-
 Oman
-
 Pakistan
-
 Palestine
-
 Panama
-
 Papua New Guinea
-
 Paraguay
-
 Peru
-
 Philippines
-
 Poland
-
 Portugal
-
 Puerto Rico
-
 Qatar
-
 Reunion
-
 Romania
-
 Rwanda
-
 Saudi Arabia
-
 Serbia
-
 Singapore
-
 Slovakia
-
 Slovenia
-
 Somalia
-
 South Africa
-
 Spain
-
 Sri Lanka
-
 Sweden
-
 Switzerland
-
 Syria
-
 Taiwan
-
 Tajikistan
-
 Tanzania
-
 Thailand
-
 Trinidad and Tobago
-
 Tunisia
-
 Turkey
-
 UAE
-
 Uganda
-
 Ukraine
-
 United Kingdom
-
United States
-
 Uruguay
-
 Uzbekistan
-
 Venezuela
-
 Vietnam
-
 Yemen
-
 Zambia
-
 Zimbabwe
- Forex
- Crypto












