

Celestia support comes into focus after a stretched decline: weekly analysis

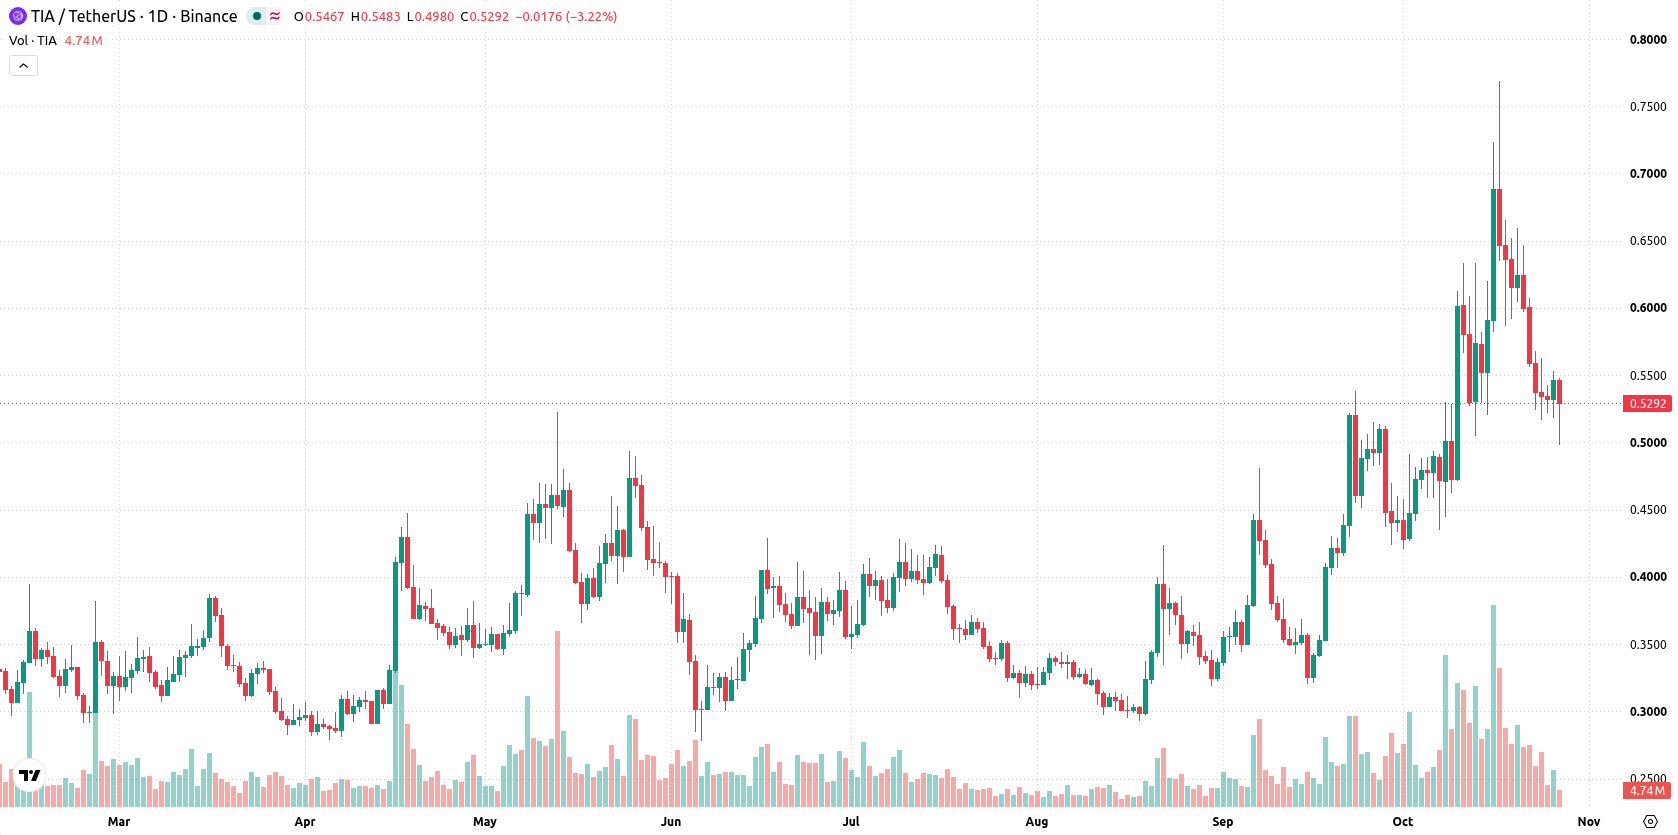
Celestia (TIA) has slumped to around $0.53 after a sharp decline of more than 17% over the past week, pushing the asset deep into oversold territory. The persistent downtrend has brought key support levels into focus, with technical readings now weighing against further aggressive selling as the market looks for stabilization.
 0.4925
0.5697
Highlights
- Celestia fell $0.1086 over the last week, closing at $0.5293 at the lower edge of its range.
- The price is in a firm downward trend with sellers dominating, but the oversold Stochastic RSI suggests a short-term pause is possible.
- Expected 7-day range is $0.4603 to $0.5982, with support at $0.5168 and resistance at $0.5699.
Major upgrade and project migration shape sentiment amid scaling and cost pressures
Celestia completed its Fibre mainnet upgrade, which was described as the project's largest since launch, introducing enhanced throughput and data availability for onchain finance and higher transaction volumes, according to CryptoNews.net. Blockchain.News reported that Derive's V3 upgrade has now integrated TIA for more predictable fees and scalable data handling. Forma Chain, previously built on TIA, will shut down on November 5, 2026, with all remaining tokens migrating to Celestia's Eden and NFTs moving to Ethereum, a decision driven by cost challenges.
Sustained selling trend persists as ADX signals strength despite oversold momentum
The daily chart reflects a sustained move lower with a firm trend, as the ADX at 33.1562 indicates strong trend strength and Bull/Bear Power continues to register seller dominance. Despite the neutral RSI, the Stochastic RSI is oversold, suggesting a possible pause or short-term rebound if selling pressure wanes. Nearest support is at $0.5168, with initial resistance at $0.5699 and the Ichimoku Kijun acting as a secondary resistance near $0.595. Volatility remained elevated at 25.21%, amplifying the risk of sharp intraday moves within this downtrend.
Consolidation base case holds with range-bound bias barring breakout events
For the next 7 days, the expected range is $0.4603 to $0.5982, with a 67% probability of an increase and a 33% chance of a decrease. The base case favors consolidation between the $0.5168 support and $0.5699 resistance. A sustained move above $0.5699 would bring $0.595 into focus, while a break below $0.5168 may open the way toward $0.4603.
Earlier, analysts noted that despite Celestia’s major network upgrades and ongoing ecosystem consolidation, bearish momentum continued to dominate price action. The current analysis reinforces this view, highlighting elevated volatility and the risk of sharp intraday moves, with $0.5168 as a key support level to monitor for potential downside extension.










-
 Afghanistan
-
 Albania
-
 Algeria
-
 Angola
-
 Argentina
-
 Armenia
-
 Australia
-
 Austria
-
 Azerbaijan
-
 Bahamas
-
 Bahrain
-
 Bangladesh
-
 Belarus
-
 Belgium
-
 Bolivia
-
 Botswana
-
 Brazil
-
 Brunei
-
 Bulgaria
-
 Cambodia
-
 Cameroon
-
 Canada
-
 Chile
-
 China
-
 Colombia
-
 Congo
-
 Costa Rica
-
 Cote d'Ivoire
-
 Croatia
-
 Cuba
-
 Cyprus
-
 Czechia
-
 DR Congo
-
 Denmark
-
 Dominican Republic
-
 Ecuador
-
 Egypt
-
 El Salvador
-
 Estonia
-
 Eswatini
-
 Ethiopia
-
 Finland
-
 France
-
 Georgia
-
 Germany
-
 Ghana
-
 Greece
-
 Haiti
-
 Hong Kong
-
 Hungary
-
 India
-
 Indonesia
-
 Iran, Islamic republic
-
 Iraq
-
 Ireland
-
 Israel
-
 Italy
-
 Jamaica
-
 Japan
-
 Jordan
-
 Kazakhstan
-
 Kenya
-
 Korea
-
 Kuwait
-
 Kyrgyzstan
-
 Laos
-
 Latvia
-
 Lebanon
-
 Lesotho
-
 Libya
-
 Lithuania
-
 Luxembourg
-
 Madagascar
-
 Malaysia
-
 Malta
-
 Mauritius
-
 Mexico
-
 Moldova
-
 Mongolia
-
 Montenegro
-
 Morocco
-
 Mozambique
-
 Myanmar
-
 Namibia
-
 Nepal
-
 Netherlands
-
 New Zealand
-
 Nigeria
-
 North Macedonia
-
 Norway
-
 Oman
-
 Pakistan
-
 Palestine
-
 Panama
-
 Papua New Guinea
-
 Paraguay
-
 Peru
-
 Philippines
-
 Poland
-
 Portugal
-
 Puerto Rico
-
 Qatar
-
 Reunion
-
 Romania
-
 Rwanda
-
 Saudi Arabia
-
 Serbia
-
 Singapore
-
 Slovakia
-
 Slovenia
-
 Somalia
-
 South Africa
-
 Spain
-
 Sri Lanka
-
 Sweden
-
 Switzerland
-
 Syria
-
 Taiwan
-
 Tajikistan
-
 Tanzania
-
 Thailand
-
 Trinidad and Tobago
-
 Tunisia
-
 Turkey
-
 UAE
-
 Uganda
-
 Ukraine
-
 United Kingdom
-
United States
-
 Uruguay
-
 Uzbekistan
-
 Venezuela
-
 Vietnam
-
 Yemen
-
 Zambia
-
 Zimbabwe
- Forex
- Crypto












