

US-Iran tensions keep Bitcoin steady despite cautious market tone

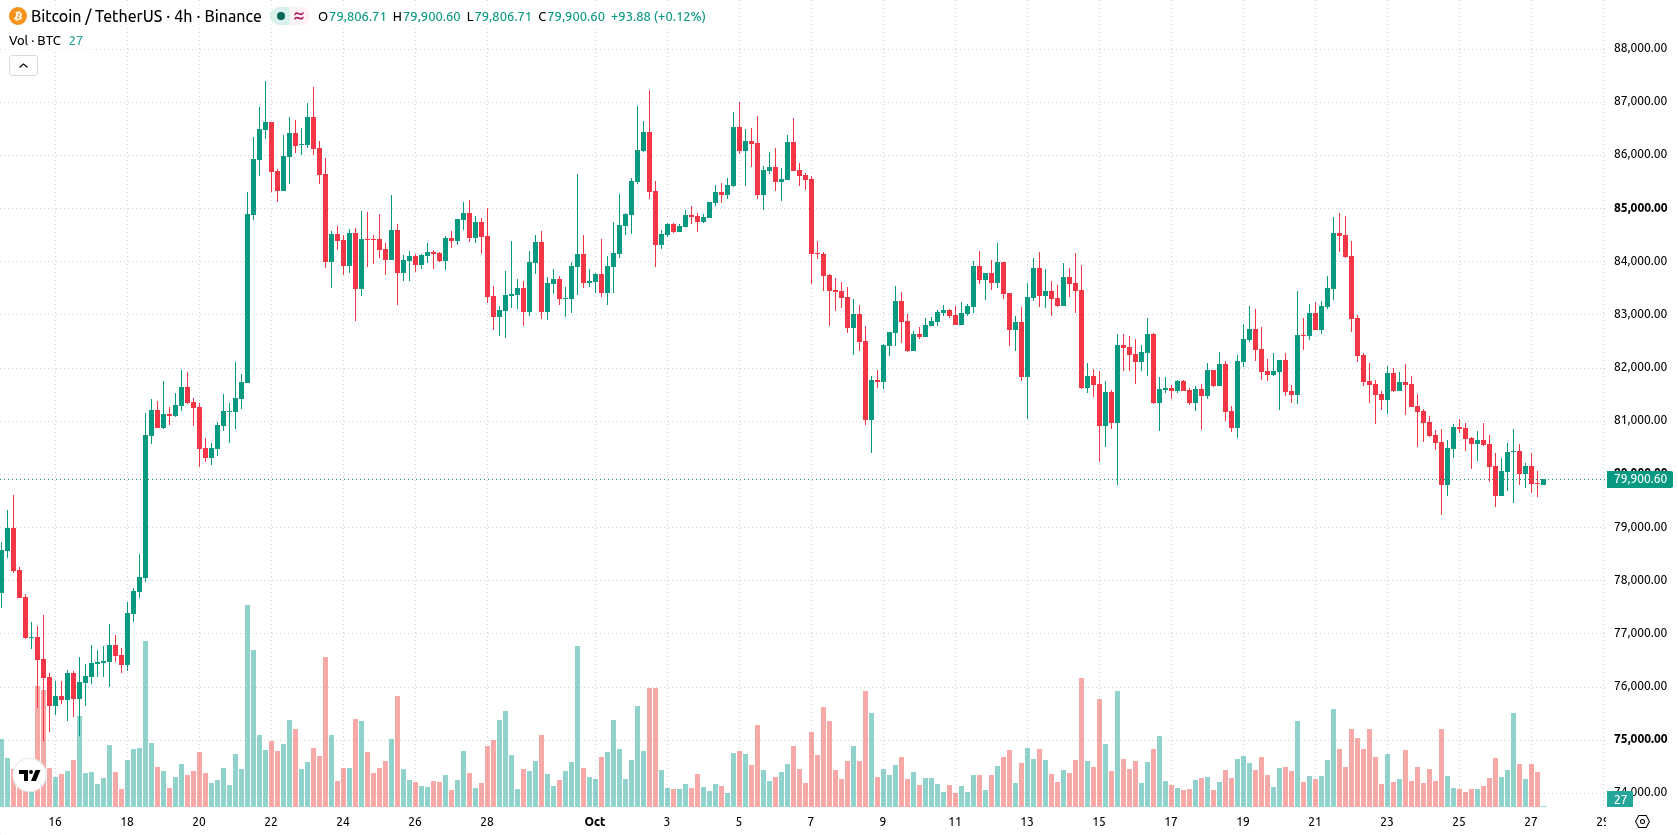
Bitcoin (BTC) is trading at $79,842, marking a modest move lower on the day. The price is currently positioned beneath its key short- and medium-term moving averages, while holding above longer-term trend markers.
 65200
74811.45
Highlights
- Investors have reduced Bitcoin exposure to limit risk before the Federal Reserve rate decision, affecting trading activity and liquidity.
- Wider risk aversion is sustained by higher oil prices and escalating US-Iran tensions, restraining demand for Bitcoin.
- BTC/USD trades below short- and medium-term moving averages with bearish indicator signals and a projected range of $77,017 to $82,380.
Risk reduction by investors amid Fed uncertainty and geopolitical strain
Investors have reduced their exposure to Bitcoin as they move to limit risk ahead of the Federal Reserve's rate decision, a shift that directly impacts trading activity and market liquidity. According to Finance Biggo, this cautious stance is further reinforced by elevated oil prices and rising US-Iran tensions, which are contributing to broader risk aversion in global markets. Although these developments underscore a defensive tone among market participants, ongoing uncertainty continues to weigh on demand for Bitcoin.
Momentum divergence and resistance capped by multiple indicators
On the technical front, BTC/USD remains capped below the MA-20 at $80,452 and MA-50 at $81,603, while support is seen at the MA-200 on the daily chart at $73,028. The Ichimoku Kijun at $80,640 acts as immediate resistance. Momentum indicators reflect persistent weakness: MACD signals a strong sell, ADX maintains a sell bias, and RSI is subdued at 42.8. Stoch RSI and Bull/Bear Power highlight overbought conditions, while both CCI and the Awesome Oscillator are neutral, creating divergence across oscillators.
Consolidation expected as downside risk outweighs reversal odds
Looking ahead, the expected trading range for BTC/USD over the next few sessions is $77,017 to $82,380, in line with typical volatility recently observed. Probabilities favor further downside, with any bullish reversal appearing unlikely unless the price breaks above $80,640 resistance. The most likely scenario is for BTC/USD to consolidate sideways, while a dip below $77,017 would confirm additional bearish momentum.
Earlier, analysts noted that persistent institutional caution and technical resistance continued to weigh on Bitcoin’s near-term outlook. This latest analysis adds the dimension of external macroeconomic risks, highlighting $77,017 as a critical support level that could signal increased downside if breached.











-
 Afghanistan
-
 Albania
-
 Algeria
-
 Angola
-
 Argentina
-
 Armenia
-
 Australia
-
 Austria
-
 Azerbaijan
-
 Bahamas
-
 Bahrain
-
 Bangladesh
-
 Belarus
-
 Belgium
-
 Bolivia
-
 Botswana
-
 Brazil
-
 Brunei
-
 Bulgaria
-
 Cambodia
-
 Cameroon
-
 Canada
-
 Chile
-
 China
-
 Colombia
-
 Congo
-
 Costa Rica
-
 Cote d'Ivoire
-
 Croatia
-
 Cuba
-
 Cyprus
-
 Czechia
-
 DR Congo
-
 Denmark
-
 Dominican Republic
-
 Ecuador
-
 Egypt
-
 El Salvador
-
 Estonia
-
 Eswatini
-
 Ethiopia
-
 Finland
-
 France
-
 Georgia
-
 Germany
-
 Ghana
-
 Greece
-
 Haiti
-
 Hong Kong
-
 Hungary
-
 India
-
 Indonesia
-
 Iran, Islamic republic
-
 Iraq
-
 Ireland
-
 Israel
-
 Italy
-
 Jamaica
-
 Japan
-
 Jordan
-
 Kazakhstan
-
 Kenya
-
 Korea
-
 Kuwait
-
 Kyrgyzstan
-
 Laos
-
 Latvia
-
 Lebanon
-
 Lesotho
-
 Libya
-
 Lithuania
-
 Luxembourg
-
 Madagascar
-
 Malaysia
-
 Malta
-
 Mauritius
-
 Mexico
-
 Moldova
-
 Mongolia
-
 Montenegro
-
 Morocco
-
 Mozambique
-
 Myanmar
-
 Namibia
-
 Nepal
-
 Netherlands
-
 New Zealand
-
 Nigeria
-
 North Macedonia
-
 Norway
-
 Oman
-
 Pakistan
-
 Palestine
-
 Panama
-
 Papua New Guinea
-
 Paraguay
-
 Peru
-
 Philippines
-
 Poland
-
 Portugal
-
 Puerto Rico
-
 Qatar
-
 Reunion
-
 Romania
-
 Rwanda
-
 Saudi Arabia
-
 Serbia
-
 Singapore
-
 Slovakia
-
 Slovenia
-
 Somalia
-
 South Africa
-
 Spain
-
 Sri Lanka
-
 Sweden
-
 Switzerland
-
 Syria
-
 Taiwan
-
 Tajikistan
-
 Tanzania
-
 Thailand
-
 Trinidad and Tobago
-
 Tunisia
-
 Turkey
-
 UAE
-
 Uganda
-
 Ukraine
-
 United Kingdom
-
United States
-
 Uruguay
-
 Uzbekistan
-
 Venezuela
-
 Vietnam
-
 Yemen
-
 Zambia
-
 Zimbabwe
- Forex
- Crypto












