

Bitcoin consolidates below resistance while seller pressure persists

Bitcoin (BTC) is trading at $79,972, posting a modest daily decline and staying close to today’s low. The price sits below its key short- and medium-term moving averages, while remaining well above long-term support.
 78878.01
81971.00
Highlights
- U.S. spot Bitcoin ETFs posted volatile flows with a $635 million outflow on October 22 after brief inflows earlier in the week.
- Strategy paused Bitcoin accumulation and shifted focus to a $204.9 million buyback, keeping its holdings unchanged during the period.
- BTC/USD trades below key moving averages with momentum indicators showing a seller-dominant bias; expected range is $78,702 to $81,290 with further downside likely.
Institutional demand cools as volatile ETF flows shift liquidity
U.S. spot Bitcoin ETFs experienced volatile capital flows in late October 2026, with significant inflows on October 20 and 21 followed by a sharp $635 million outflow on October 22, according to Economictimes Indiatimes. These rapid swings indicate fluctuating institutional engagement, impacting both short-term liquidity and underlying demand for Bitcoin. Kitco reported that, despite a temporary spike in ETF inflows, the average daily pace since July 1 dropped markedly, signaling a broader cooling in buying support. Additionally, Strategy (formerly MicroStrategy) paused Bitcoin purchases during the week, focusing instead on a $204.9 million buyback of STRC preferred stock and leaving its Bitcoin holdings unchanged, according to Bitcoinfoundation.
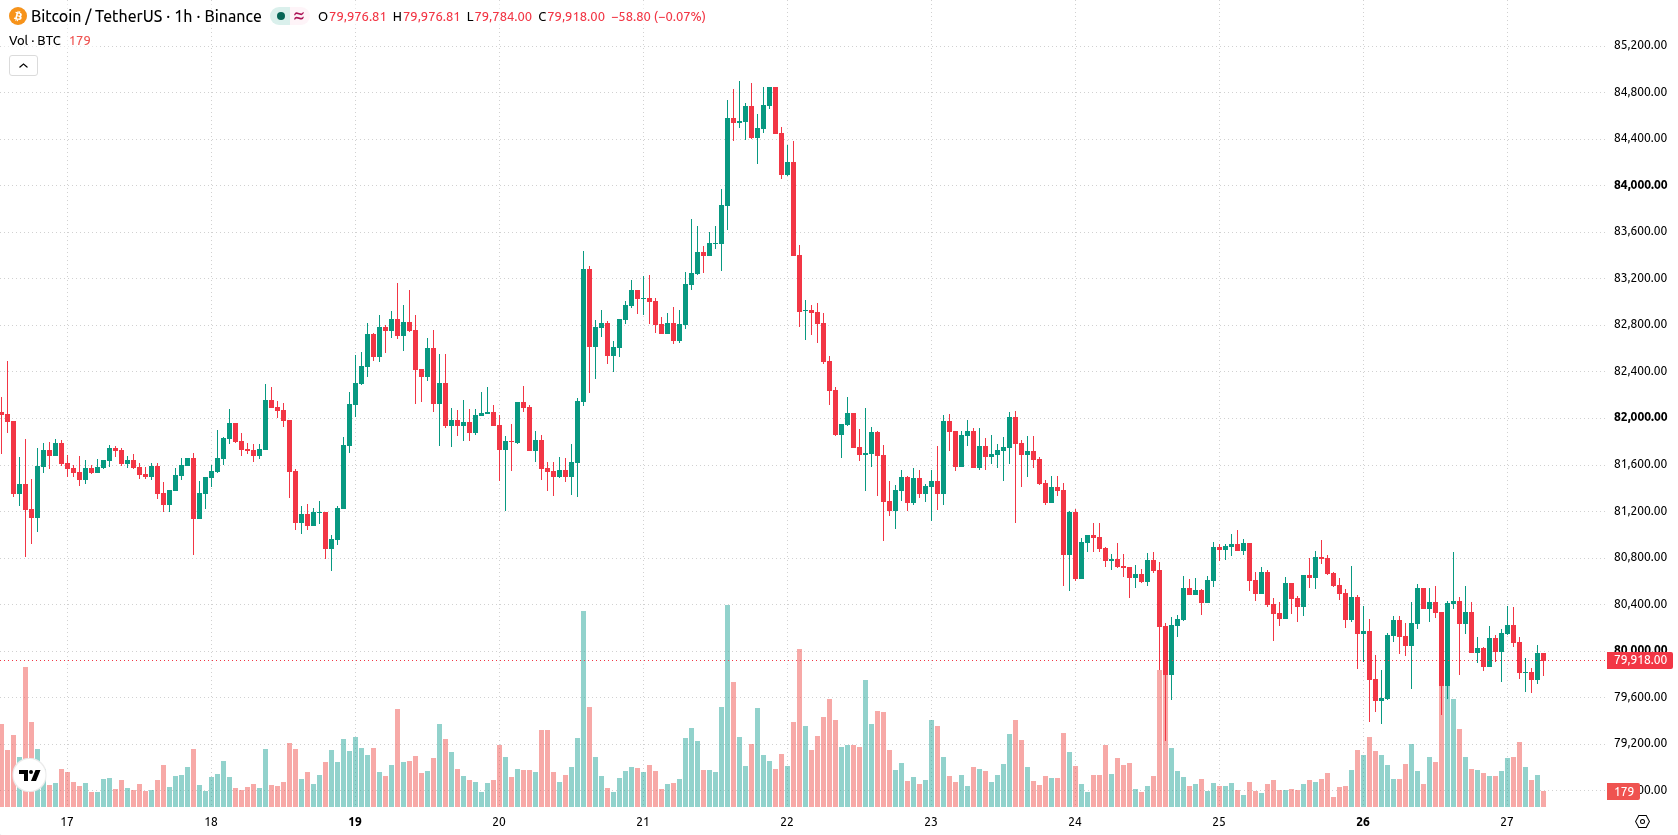
Downside momentum persists as resistance and indicators align
BTC/USD remains capped by the MA-20 at $80,131 and MA-50 at $80,280, both now acting as resistance, while maintaining a wide cushion above the MA-200 at $73,028. The Ichimoku Kijun level at $80,106 is also a technical barrier limiting upside. Momentum indicators MACD and ADX continue to signal sell conditions, with the RSI at 42.22 confirming a seller bias. Stoch RSI, CCI, and Bull/Bear Power each show the pair in oversold or seller-dominated territory, while the Awesome Oscillator supports the prevailing downside momentum.
Consolidation favored unless resistance clears or support fails
BTC/USD is expected to trade in a tight range over the next 2–3 days, with the $78,702 to $81,290 band defining typical volatility relative to current levels. A bullish rebound remains unlikely unless the price is able to recapture and hold above resistance at $80,106. If support near $78,702 fails, further near-term downside is probable, while the most likely scenario is continued consolidation within these bounds.
Earlier, analysts noted that persistent institutional outflows and cautious macroeconomic signals had maintained downside pressure on Bitcoin. The current analysis reinforces this theme by showing continued institutional hesitation and technical barriers, with traders advised to monitor the $78,702 support as a potential trigger for further short-term declines should it break.











-
 Afghanistan
-
 Albania
-
 Algeria
-
 Angola
-
 Argentina
-
 Armenia
-
 Australia
-
 Austria
-
 Azerbaijan
-
 Bahamas
-
 Bahrain
-
 Bangladesh
-
 Belarus
-
 Belgium
-
 Bolivia
-
 Botswana
-
 Brazil
-
 Brunei
-
 Bulgaria
-
 Cambodia
-
 Cameroon
-
 Canada
-
 Chile
-
 China
-
 Colombia
-
 Congo
-
 Costa Rica
-
 Cote d'Ivoire
-
 Croatia
-
 Cuba
-
 Cyprus
-
 Czechia
-
 DR Congo
-
 Denmark
-
 Dominican Republic
-
 Ecuador
-
 Egypt
-
 El Salvador
-
 Estonia
-
 Eswatini
-
 Ethiopia
-
 Finland
-
 France
-
 Georgia
-
 Germany
-
 Ghana
-
 Greece
-
 Haiti
-
 Hong Kong
-
 Hungary
-
 India
-
 Indonesia
-
 Iran, Islamic republic
-
 Iraq
-
 Ireland
-
 Israel
-
 Italy
-
 Jamaica
-
 Japan
-
 Jordan
-
 Kazakhstan
-
 Kenya
-
 Korea
-
 Kuwait
-
 Kyrgyzstan
-
 Laos
-
 Latvia
-
 Lebanon
-
 Lesotho
-
 Libya
-
 Lithuania
-
 Luxembourg
-
 Madagascar
-
 Malaysia
-
 Malta
-
 Mauritius
-
 Mexico
-
 Moldova
-
 Mongolia
-
 Montenegro
-
 Morocco
-
 Mozambique
-
 Myanmar
-
 Namibia
-
 Nepal
-
 Netherlands
-
 New Zealand
-
 Nigeria
-
 North Macedonia
-
 Norway
-
 Oman
-
 Pakistan
-
 Palestine
-
 Panama
-
 Papua New Guinea
-
 Paraguay
-
 Peru
-
 Philippines
-
 Poland
-
 Portugal
-
 Puerto Rico
-
 Qatar
-
 Reunion
-
 Romania
-
 Rwanda
-
 Saudi Arabia
-
 Serbia
-
 Singapore
-
 Slovakia
-
 Slovenia
-
 Somalia
-
 South Africa
-
 Spain
-
 Sri Lanka
-
 Sweden
-
 Switzerland
-
 Syria
-
 Taiwan
-
 Tajikistan
-
 Tanzania
-
 Thailand
-
 Trinidad and Tobago
-
 Tunisia
-
 Turkey
-
 UAE
-
 Uganda
-
 Ukraine
-
 United Kingdom
-
United States
-
 Uruguay
-
 Uzbekistan
-
 Venezuela
-
 Vietnam
-
 Yemen
-
 Zambia
-
 Zimbabwe
- Forex
- Crypto












