

Bitcoin gains more than 5% after volatile rebound amid record outflows from US ETFs

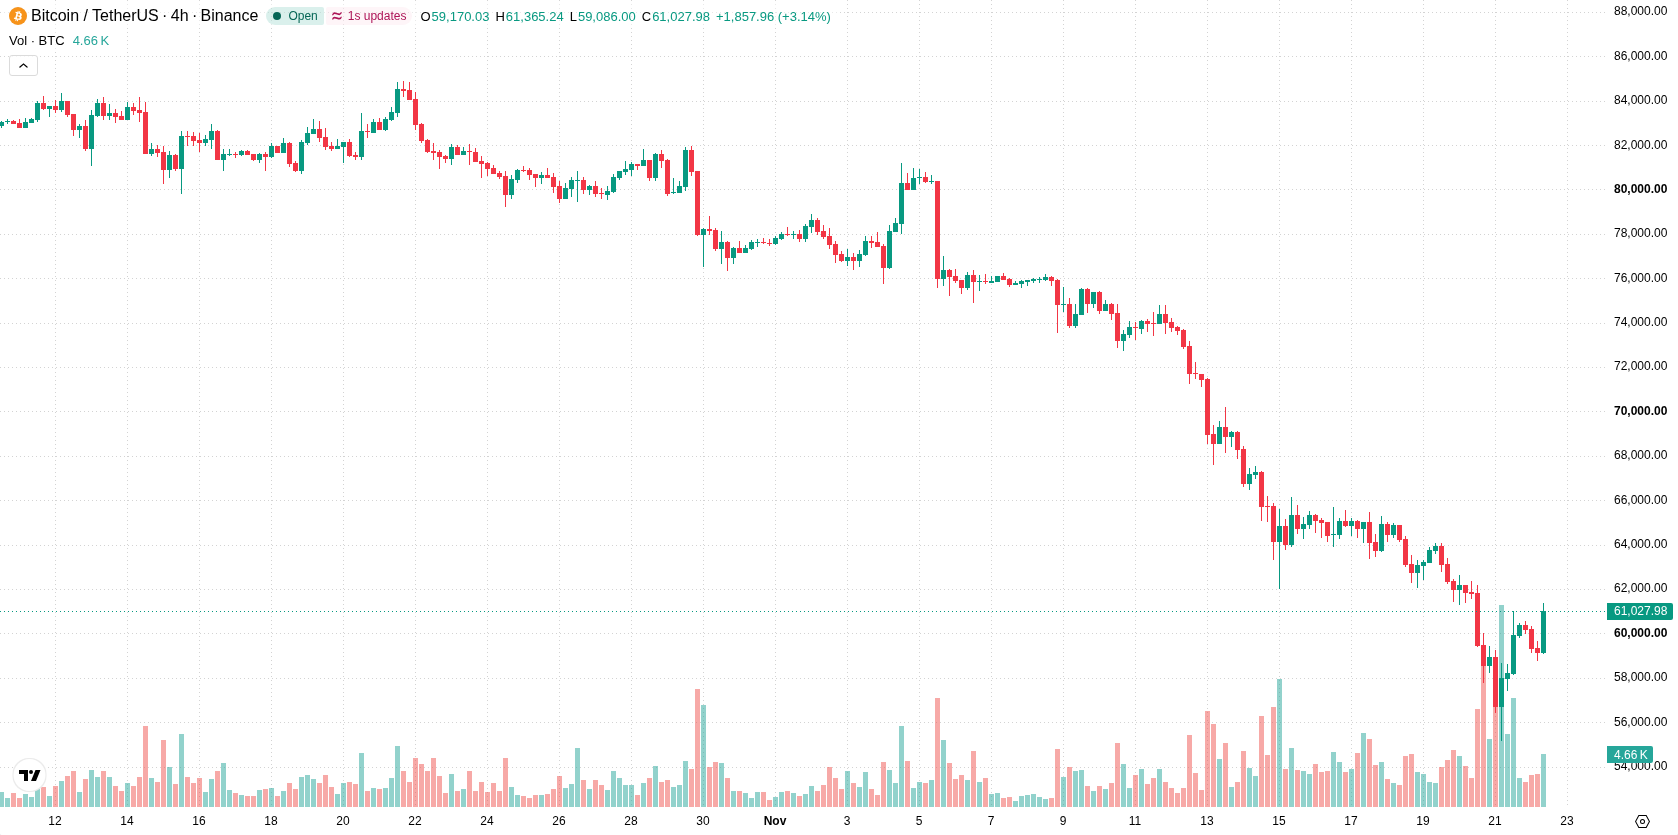
Bitcoin (BTC) surged 5.19% on renewed demand as short covering intensified, even as heavy outflows from U.S. spot Bitcoin ETFs remained a dominant backdrop. The rebound looks limited, with BTC still trading below its 20-day, 50-day, and 200-day moving averages, highlighting ongoing downside pressure.
 60352.16
65696.16
Highlights
- Bitcoin dropped to a two-year low near $55,000 before rebounding above $60,000, with $3.47 billion in U.S. spot ETF outflows recorded.
- Nearly $950 billion in invested Bitcoin capital fell below cost basis and forced liquidations occurred alongside increased trading volume and net ETF accumulation in Q3.
- BTC/USD trades below major moving averages with weak momentum signals and is expected to range between $53,471 and $66,363 over the next five sessions.
Volatility intensifies amid record ETF outflows and large-scale liquidations
In November, Bitcoin experienced significant volatility, reaching a two-year low near $55,000 before recovering above $60,000. The decline coincided with over $3.47 billion in outflows from U.S. spot Bitcoin ETFs, including a single-day record withdrawal of $541 million from BlackRock’s iShares Bitcoin Trust. Financial pressure increased as almost $950 billion in invested Bitcoin capital fell below its cost basis, while forced liquidations and a risk-off environment impacted sentiment. Trading volume rose to its highest since February as institutional ETF flows showed a net accumulation of 49,229 BTC in Q3.
Bearish momentum persists as major moving averages cap upside
BTC/USD remains below its 20-day, 50-day, and 200-day moving averages at $70,193, $77,230, and $72,485, signaling continued downside pressure across all major timeframes. Immediate resistance sits at $65,696, while support is seen at $60,352. The alignment of the 50-day above the 200-day moving average reflects a still-bullish long-term trend. Momentum indicators, including MACD and ADX, continue to suggest weakness. The Relative Strength Index (RSI) and Commodity Channel Index (CCI) are both in oversold zones, highlighting potential for a rebound, while the Stochastic RSI remains neutral. Intraday momentum favors sellers as BBP is negative and the Awesome Oscillator confirms bearish conditions, although the latest session saw a $3,013.28 jump and price nearing the day’s high amid intraday volatility of 2.69%.
Previously it was reported that abrupt liquidity disruptions in specific regional markets led to significant, albeit temporary, dislocations in Bitcoin pricing. The current analysis adds a broader perspective by highlighting persistent downside risks and elevated volatility, underscoring the importance of monitoring the $60,352 support level for signals of further downside toward $53,471.










-
 Afghanistan
-
 Albania
-
 Algeria
-
 Angola
-
 Argentina
-
 Armenia
-
 Australia
-
 Austria
-
 Azerbaijan
-
 Bahamas
-
 Bahrain
-
 Bangladesh
-
 Belarus
-
 Belgium
-
 Bolivia
-
 Botswana
-
 Brazil
-
 Brunei
-
 Bulgaria
-
 Cambodia
-
 Cameroon
-
 Canada
-
 Chile
-
 China
-
 Colombia
-
 Congo
-
 Costa Rica
-
 Cote d'Ivoire
-
 Croatia
-
 Cuba
-
 Cyprus
-
 Czechia
-
 DR Congo
-
 Denmark
-
 Dominican Republic
-
 Ecuador
-
 Egypt
-
 El Salvador
-
 Estonia
-
 Eswatini
-
 Ethiopia
-
 Finland
-
 France
-
 Georgia
-
 Germany
-
 Ghana
-
 Greece
-
 Haiti
-
 Hong Kong
-
 Hungary
-
 India
-
 Indonesia
-
 Iran, Islamic republic
-
 Iraq
-
 Ireland
-
 Israel
-
 Italy
-
 Jamaica
-
 Japan
-
 Jordan
-
 Kazakhstan
-
 Kenya
-
 Korea
-
 Kuwait
-
 Kyrgyzstan
-
 Laos
-
 Latvia
-
 Lebanon
-
 Lesotho
-
 Libya
-
 Lithuania
-
 Luxembourg
-
 Madagascar
-
 Malaysia
-
 Malta
-
 Mauritius
-
 Mexico
-
 Moldova
-
 Mongolia
-
 Montenegro
-
 Morocco
-
 Mozambique
-
 Myanmar
-
 Namibia
-
 Nepal
-
 Netherlands
-
 New Zealand
-
 Nigeria
-
 North Macedonia
-
 Norway
-
 Oman
-
 Pakistan
-
 Palestine
-
 Panama
-
 Papua New Guinea
-
 Paraguay
-
 Peru
-
 Philippines
-
 Poland
-
 Portugal
-
 Puerto Rico
-
 Qatar
-
 Reunion
-
 Romania
-
 Rwanda
-
 Saudi Arabia
-
 Serbia
-
 Singapore
-
 Slovakia
-
 Slovenia
-
 Somalia
-
 South Africa
-
 Spain
-
 Sri Lanka
-
 Sweden
-
 Switzerland
-
 Syria
-
 Taiwan
-
 Tajikistan
-
 Tanzania
-
 Thailand
-
 Trinidad and Tobago
-
 Tunisia
-
 Turkey
-
 UAE
-
 Uganda
-
 Ukraine
-
 United Kingdom
-
United States
-
 Uruguay
-
 Uzbekistan
-
 Venezuela
-
 Vietnam
-
 Yemen
-
 Zambia
-
 Zimbabwe
- Forex
- Crypto












