

Polkadot weekly forecast: Support comes into focus after a stretched decline

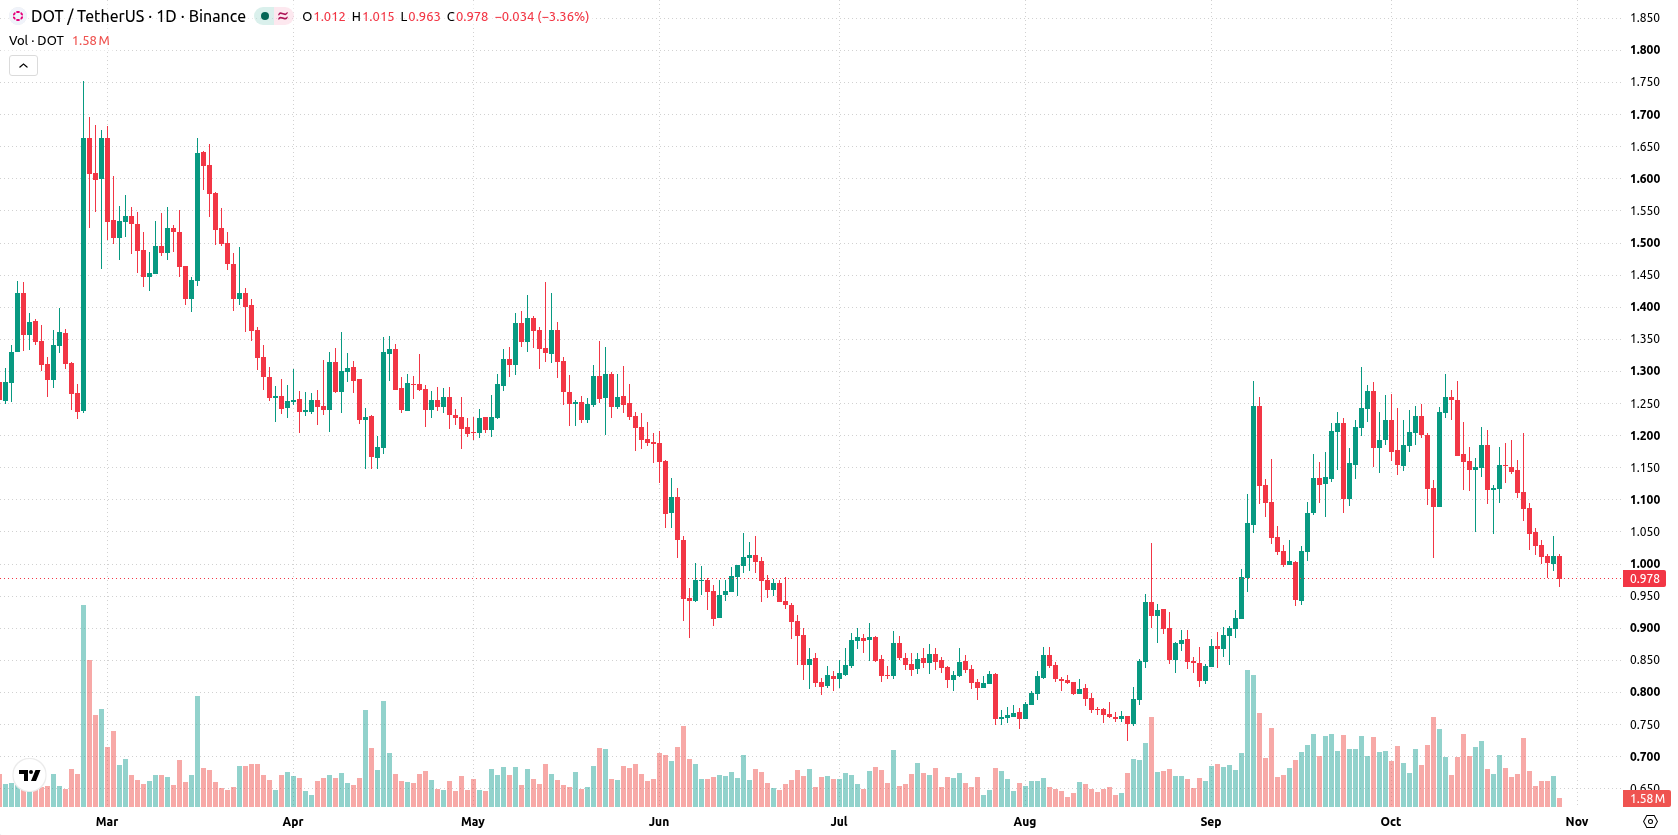
Polkadot (DOT) remains near $0.98 after falling more than 12% over the past week, as persistent heavy selling brings a key support zone into focus. A stretch of downside momentum means support levels will be critical to watch as the coming week unfolds.
 0.951
1.043
Highlights
- Polkadot trades at $0.978, losing 12.66% over the past seven days and ending at the bottom of its weekly range.
- The price remains below key moving averages with persistent selling pressure, and technical indicators confirm prevailing downside momentum.
- Expected range for the next week is $0.858 to $1.097, with a 77% probability of further decline unless resistance at $1.037 is reclaimed.
Supply cap and tokenomics reform countered by fund launch and security risks this week
Polkadot set a 2.1 billion DOT supply cap and reduced its annual issuance to 55 million DOT, aiming to bring more predictability to its token economy, according to TokenPost. Despite these measures, DOT continues to struggle with market declines. The launch of the 21Shares Polkadot ETF in March 2026 and ongoing governance updates, including a Technical Fellowship finding of a supply discrepancy in the dotUSD pool that impacted the Polkadot Treasury’s liquidity by $1.3 million, were also reported by TokenPost. A security incident in the Polkadot Fearless Wallet exposed vulnerabilities related to a shortened staking withdrawal period, as noted by the Polkadot Community Foundation.
Weekly momentum remains bearish as MACD and oscillators track persistent downside
The daily chart shows Polkadot under persistent selling pressure, with momentum characterized by a sharp move lower without a sustained trend and 23.13% weekly volatility. MACD, Bull/Bear Power, and the Awesome Oscillator all point to continued downside momentum. Support is holding at $0.977, while the nearest resistance is $1.037 at the 200-day moving average, with the Ichimoku Kijun at $1.137 acting as an additional resistance barrier. Oscillators currently show CCI and Stochastic RSI in oversold zones, suggesting potential for near-term rebound, but the overall setup remains cautious as long as price remains below resistance.
Downside risk dominates the weekly outlook as range support faces further tests
Over the next 7 days, the expected range is $0.858 to $1.097, with a 23% probability of an increase and a 77% probability of a decrease. The base case is continued choppy action within this range, anchored by support at $0.977 and capped by resistance at $1.037. A move above $1.037 would signal potential recovery toward $1.097. If the price decisively breaks below $0.977, further downside risk opens toward $0.858.
Earlier, analysts noted that Polkadot continued to face persistent selling pressure despite major changes to its tokenomics. This outlook remains intact as the current article highlights ongoing downside momentum and warns that a decisive break below the $0.977 support could expose further risk toward $0.858 in the week ahead.










-
 Afghanistan
-
 Albania
-
 Algeria
-
 Angola
-
 Argentina
-
 Armenia
-
 Australia
-
 Austria
-
 Azerbaijan
-
 Bahamas
-
 Bahrain
-
 Bangladesh
-
 Belarus
-
 Belgium
-
 Bolivia
-
 Botswana
-
 Brazil
-
 Brunei
-
 Bulgaria
-
 Cambodia
-
 Cameroon
-
 Canada
-
 Chile
-
 China
-
 Colombia
-
 Congo
-
 Costa Rica
-
 Cote d'Ivoire
-
 Croatia
-
 Cuba
-
 Cyprus
-
 Czechia
-
 DR Congo
-
 Denmark
-
 Dominican Republic
-
 Ecuador
-
 Egypt
-
 El Salvador
-
 Estonia
-
 Eswatini
-
 Ethiopia
-
 Finland
-
 France
-
 Georgia
-
 Germany
-
 Ghana
-
 Greece
-
 Haiti
-
 Hong Kong
-
 Hungary
-
 India
-
 Indonesia
-
 Iran, Islamic republic
-
 Iraq
-
 Ireland
-
 Israel
-
 Italy
-
 Jamaica
-
 Japan
-
 Jordan
-
 Kazakhstan
-
 Kenya
-
 Korea
-
 Kuwait
-
 Kyrgyzstan
-
 Laos
-
 Latvia
-
 Lebanon
-
 Lesotho
-
 Libya
-
 Lithuania
-
 Luxembourg
-
 Madagascar
-
 Malaysia
-
 Malta
-
 Mauritius
-
 Mexico
-
 Moldova
-
 Mongolia
-
 Montenegro
-
 Morocco
-
 Mozambique
-
 Myanmar
-
 Namibia
-
 Nepal
-
 Netherlands
-
 New Zealand
-
 Nigeria
-
 North Macedonia
-
 Norway
-
 Oman
-
 Pakistan
-
 Palestine
-
 Panama
-
 Papua New Guinea
-
 Paraguay
-
 Peru
-
 Philippines
-
 Poland
-
 Portugal
-
 Puerto Rico
-
 Qatar
-
 Reunion
-
 Romania
-
 Rwanda
-
 Saudi Arabia
-
 Serbia
-
 Singapore
-
 Slovakia
-
 Slovenia
-
 Somalia
-
 South Africa
-
 Spain
-
 Sri Lanka
-
 Sweden
-
 Switzerland
-
 Syria
-
 Taiwan
-
 Tajikistan
-
 Tanzania
-
 Thailand
-
 Trinidad and Tobago
-
 Tunisia
-
 Turkey
-
 UAE
-
 Uganda
-
 Ukraine
-
 United Kingdom
-
United States
-
 Uruguay
-
 Uzbekistan
-
 Venezuela
-
 Vietnam
-
 Yemen
-
 Zambia
-
 Zimbabwe
- Forex
- Crypto












