

Polkadot price prediction: Downside momentum persists as sellers keep control

Polkadot (DOT) is trading at $0.66 after a sharp decline of 7.04% on the day, tracking near the session lows amid elevated volatility. The current price remains below its key short- and long-term moving averages, signaling sustained downward momentum.
 0.667
0.747
Highlights
- Polkadot on-chain governance approved a major strategy shift to drive user growth using privacy-first, no-login products and dotStables such as dotUSD.
- The new Polkadot App will add private messaging and digital cash functions as project tracking moves from developer metrics to user and usage data.
- DOT/USD trades under key moving averages with technical indicators bearish and price expected to consolidate in the $0.574 to $0.691 range, with very low probability for gains.
User-focused strategy approved as price stays under selling pressure
Polkadot’s on-chain governance, DOT DAO, has approved Referendum 1954 with near-unanimous support, enacting a new strategy that targets user growth through privacy-protecting, no-login products and the planned rollout of dotStables, including dotUSD, as permissionless stable-value tokens, according to GlobeNewswire. The upcoming launch of the Polkadot App will introduce private messaging and digital cash features, with the Polkadot Community Foundation set to coordinate the alignment of ecosystem-funded entities under this user-focused approach. Additionally, project performance tracking will transition from developer activity to user and usage data, although price action has remained under broader selling pressure.
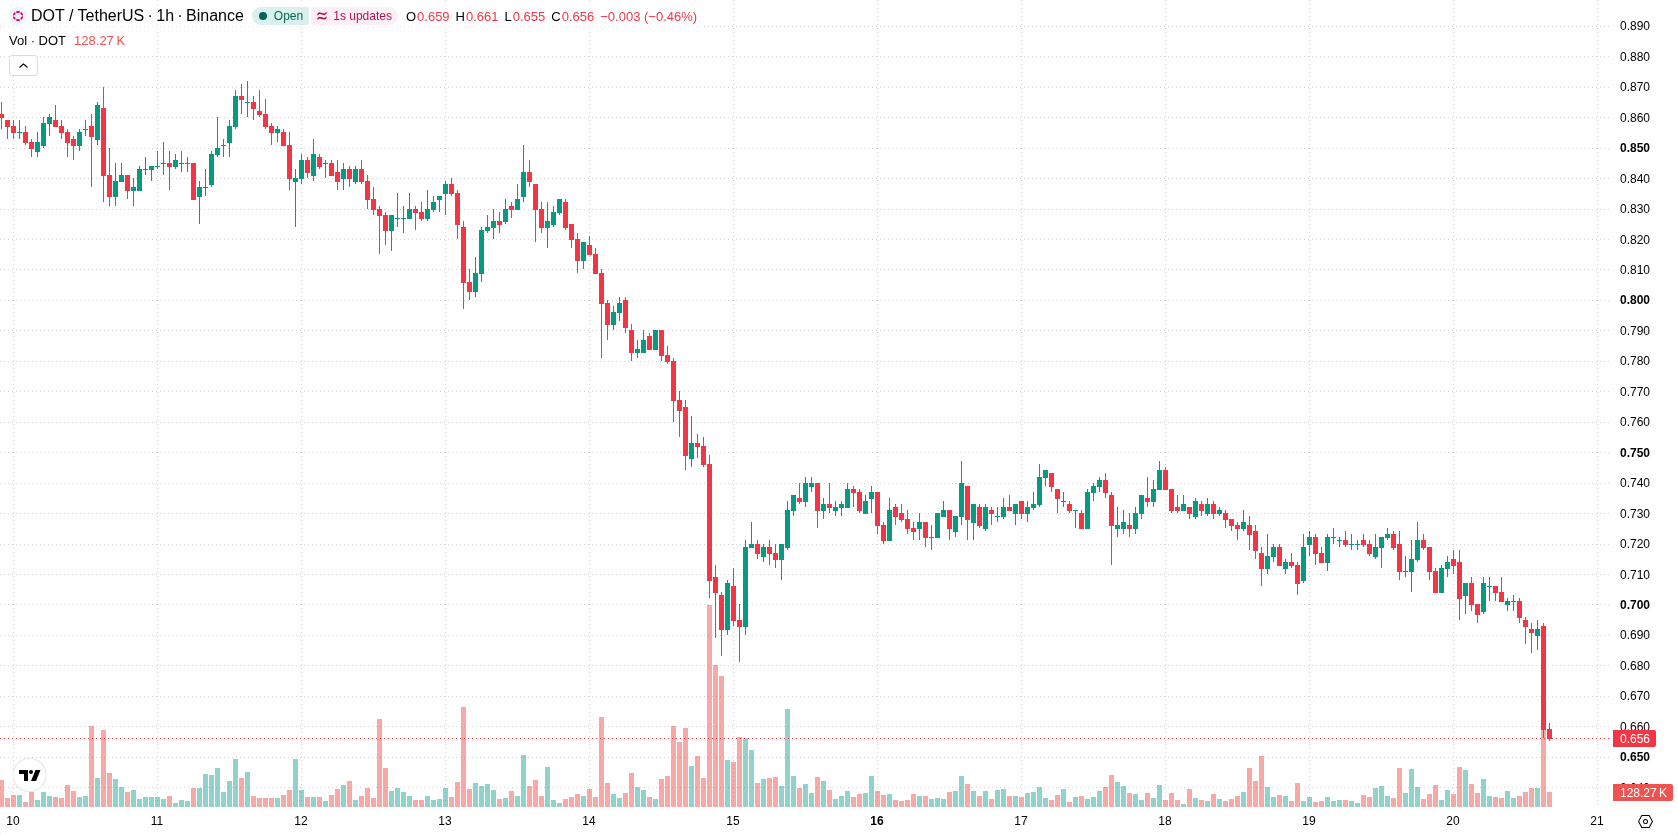
Bearish momentum intensifies as DOT tests oversold indicator levels
On the technical front, DOT/USD is positioned below H1 SMA-20 at $0.702, H1 SMA-50 at $0.711, and D1 SMA-200 at $0.994. The Ichimoku Kijun level at $0.705 serves as immediate resistance. Momentum indicators present a predominantly bearish setup, with MACD and ADX both showing sell conditions. RSI remains in the neutral range, while Stoch RSI and CCI point to oversold conditions. Bull/Bear Power is negative and the Awesome Oscillator also displays a sell signal. Mixed signals are present among oscillators, as oversold readings coincide with a neutral RSI.
Further downside expected as upside reversal odds remain low
Over the next 2–3 trading days, the expected price range for DOT is $0.574 to $0.691, representing a typical volatility band relative to current levels. The probability of an upward reversal remains very low as technical signals continue to favor downside momentum, making further gains unlikely without a break above the immediate resistance at $0.705. Should sellers push the price below support near $0.574, additional declines may be seen. Otherwise, price consolidation within the projected range is the baseline scenario.
Earlier, analysts noted that Polkadot faced sustained bearish pressure despite major governance changes and efforts to drive broader adoption through user-focused products. The current technical setup continues to reinforce this downside risk, with the key level to watch now being a breakdown below $0.574, which could trigger further declines in the days ahead.










-
 Afghanistan
-
 Albania
-
 Algeria
-
 Angola
-
 Argentina
-
 Armenia
-
 Australia
-
 Austria
-
 Azerbaijan
-
 Bahamas
-
 Bahrain
-
 Bangladesh
-
 Belarus
-
 Belgium
-
 Bolivia
-
 Botswana
-
 Brazil
-
 Brunei
-
 Bulgaria
-
 Cambodia
-
 Cameroon
-
 Canada
-
 Chile
-
 China
-
 Colombia
-
 Congo
-
 Costa Rica
-
 Cote d'Ivoire
-
 Croatia
-
 Cuba
-
 Cyprus
-
 Czechia
-
 DR Congo
-
 Denmark
-
 Dominican Republic
-
 Ecuador
-
 Egypt
-
 El Salvador
-
 Estonia
-
 Eswatini
-
 Ethiopia
-
 Finland
-
 France
-
 Georgia
-
 Germany
-
 Ghana
-
 Greece
-
 Haiti
-
 Hong Kong
-
 Hungary
-
 India
-
 Indonesia
-
 Iran, Islamic republic
-
 Iraq
-
 Ireland
-
 Israel
-
 Italy
-
 Jamaica
-
 Japan
-
 Jordan
-
 Kazakhstan
-
 Kenya
-
 Korea
-
 Kuwait
-
 Kyrgyzstan
-
 Laos
-
 Latvia
-
 Lebanon
-
 Lesotho
-
 Libya
-
 Lithuania
-
 Luxembourg
-
 Madagascar
-
 Malaysia
-
 Malta
-
 Mauritius
-
 Mexico
-
 Moldova
-
 Mongolia
-
 Montenegro
-
 Morocco
-
 Mozambique
-
 Myanmar
-
 Namibia
-
 Nepal
-
 Netherlands
-
 New Zealand
-
 Nigeria
-
 North Macedonia
-
 Norway
-
 Oman
-
 Pakistan
-
 Palestine
-
 Panama
-
 Papua New Guinea
-
 Paraguay
-
 Peru
-
 Philippines
-
 Poland
-
 Portugal
-
 Puerto Rico
-
 Qatar
-
 Reunion
-
 Romania
-
 Rwanda
-
 Saudi Arabia
-
 Serbia
-
 Singapore
-
 Slovakia
-
 Slovenia
-
 Somalia
-
 South Africa
-
 Spain
-
 Sri Lanka
-
 Sweden
-
 Switzerland
-
 Syria
-
 Taiwan
-
 Tajikistan
-
 Tanzania
-
 Thailand
-
 Trinidad and Tobago
-
 Tunisia
-
 Turkey
-
 UAE
-
 Uganda
-
 Ukraine
-
 United Kingdom
-
United States
-
 Uruguay
-
 Uzbekistan
-
 Venezuela
-
 Vietnam
-
 Yemen
-
 Zambia
-
 Zimbabwe
- Forex
- Crypto












