


Maple (SYRUP) slumped 9.8% as heavy selling pressure and deeply negative momentum signals drove a sharp downside move. The decline is supported by price action remaining below all major moving averages, confirming a persistent bearish structure.
 0.1519
0.1828
Highlights
- SYRUP/USD continues to trade below major moving averages, maintaining a bearish short-, medium-, and long-term trend.
- Momentum indicators are deeply oversold and sellers remain in control, though the absence of a strong trend suggests limited conviction.
- Forecast range for the next five trading days is $0.127 to $0.1746, with over 80% probability of a continued decline.
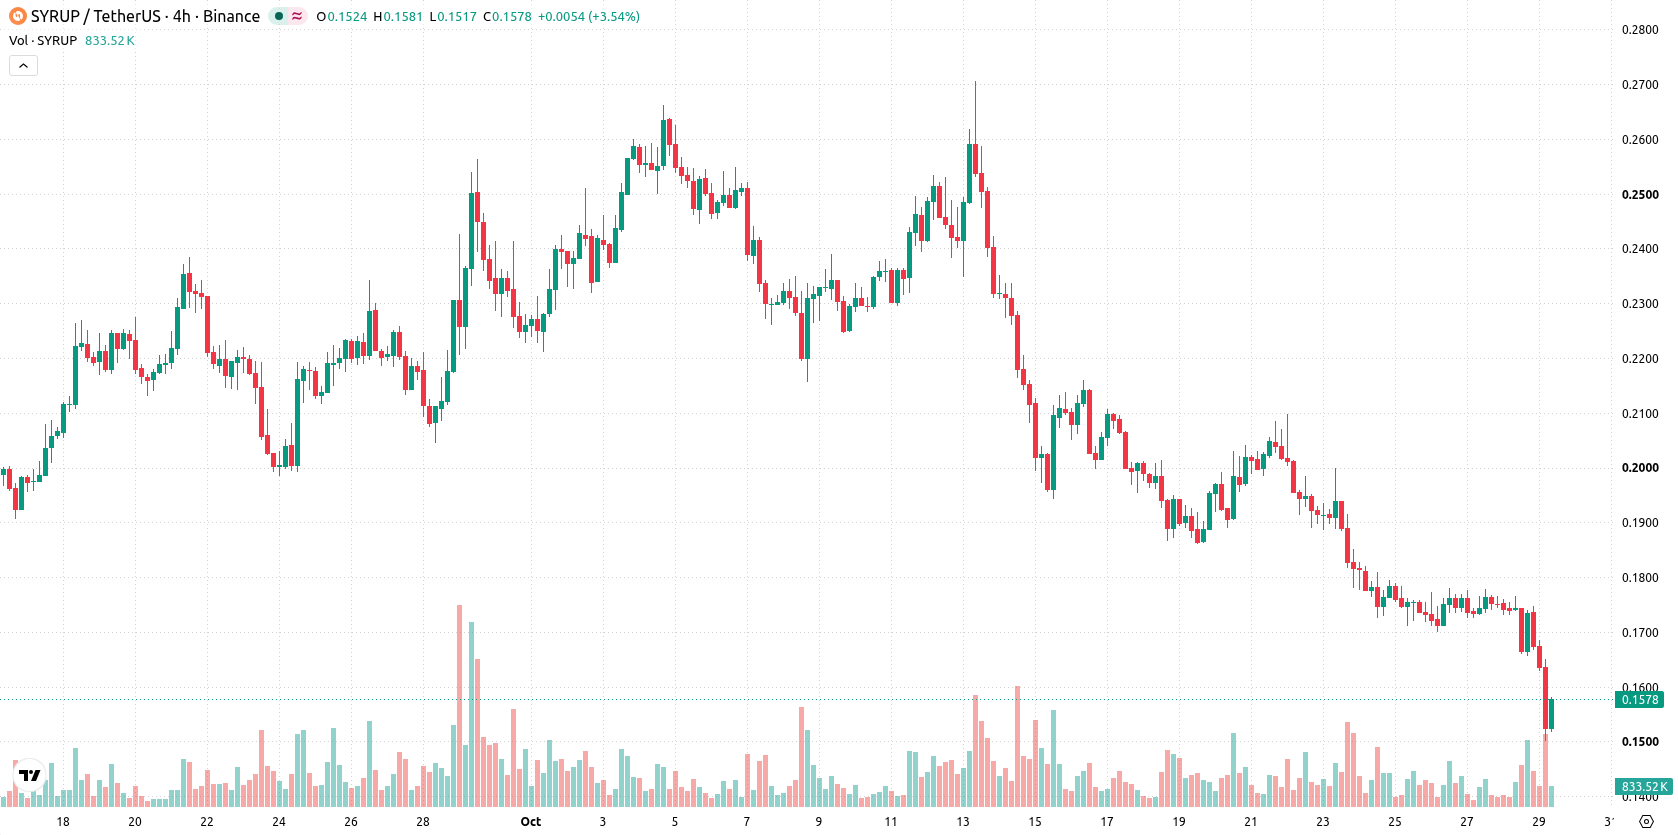
Bearish bias confirmed as moves stay below technical resistance
SYRUP/USD remains under pressure, as price trades below the 20-, 50-, and 200-day moving averages ($0.2024, $0.2158, and $0.1923 respectively), reinforcing a bearish outlook across short-, medium-, and long-term trends. The near-term ceiling is set at $0.1656 with immediate support at the near-term floor of $0.1533, while the Ichimoku Kijun ($0.2181) confirms resistance remains well above the market. Daily momentum signals remain negative as the Moving Average Convergence Divergence (MACD) points to continued selling, with the Average Directional Index (ADX) at 18.84 suggesting the trend lacks strong conviction. The Relative Strength Index (RSI) has sunk to 29.39 and Commodity Channel Index (CCI) stands at -110.26, both indicating oversold conditions, a view reinforced by the deeply oversold Stochastic RSI at 3.37. Bull/Bear Power (BBP) registers -0.012, clearly showing sellers dominate intraday momentum and supports the oversold signal. The Awesome Oscillator (AO) also aligns with this downtrend. Today, the pair declined to $0.1574, slipping 0.0171 or 9.8% with a downside gap of about 3.95%. Price action sits near the session’s low, and intraday volatility stands at 9.98%. Tone remains heavy, as momentum and intraday direction are closely aligned to the downside.
Earlier, analysts noted that Maple was facing persistent downside pressure with little sign of a technical reversal. The latest market movement reinforces the bearish outlook, making the $0.1533 support a critical level for traders to monitor in the event of further volatility.






Latest Maple News




-
 Afghanistan
-
 Albania
-
 Algeria
-
 Angola
-
 Argentina
-
 Armenia
-
 Australia
-
 Austria
-
 Azerbaijan
-
 Bahamas
-
 Bahrain
-
 Bangladesh
-
 Belarus
-
 Belgium
-
 Bolivia
-
 Botswana
-
 Brazil
-
 Brunei
-
 Bulgaria
-
 Cambodia
-
 Cameroon
-
 Canada
-
 Chile
-
 China
-
 Colombia
-
 Congo
-
 Costa Rica
-
 Cote d'Ivoire
-
 Croatia
-
 Cuba
-
 Cyprus
-
 Czechia
-
 DR Congo
-
 Denmark
-
 Dominican Republic
-
 Ecuador
-
 Egypt
-
 El Salvador
-
 Estonia
-
 Eswatini
-
 Ethiopia
-
 Finland
-
 France
-
 Georgia
-
 Germany
-
 Ghana
-
 Greece
-
 Haiti
-
 Hong Kong
-
 Hungary
-
 India
-
 Indonesia
-
 Iran, Islamic republic
-
 Iraq
-
 Ireland
-
 Israel
-
 Italy
-
 Jamaica
-
 Japan
-
 Jordan
-
 Kazakhstan
-
 Kenya
-
 Korea
-
 Kuwait
-
 Kyrgyzstan
-
 Laos
-
 Latvia
-
 Lebanon
-
 Lesotho
-
 Libya
-
 Lithuania
-
 Luxembourg
-
 Madagascar
-
 Malaysia
-
 Malta
-
 Mauritius
-
 Mexico
-
 Moldova
-
 Mongolia
-
 Montenegro
-
 Morocco
-
 Mozambique
-
 Myanmar
-
 Namibia
-
 Nepal
-
 Netherlands
-
 New Zealand
-
 Nigeria
-
 North Macedonia
-
 Norway
-
 Oman
-
 Pakistan
-
 Palestine
-
 Panama
-
 Papua New Guinea
-
 Paraguay
-
 Peru
-
 Philippines
-
 Poland
-
 Portugal
-
 Puerto Rico
-
 Qatar
-
 Reunion
-
 Romania
-
 Rwanda
-
 Saudi Arabia
-
 Serbia
-
 Singapore
-
 Slovakia
-
 Slovenia
-
 Somalia
-
 South Africa
-
 Spain
-
 Sri Lanka
-
 Sweden
-
 Switzerland
-
 Syria
-
 Taiwan
-
 Tajikistan
-
 Tanzania
-
 Thailand
-
 Trinidad and Tobago
-
 Tunisia
-
 Turkey
-
 UAE
-
 Uganda
-
 Ukraine
-
 United Kingdom
-
United States
-
 Uruguay
-
 Uzbekistan
-
 Venezuela
-
 Vietnam
-
 Yemen
-
 Zambia
-
 Zimbabwe
- Forex
- Crypto












