

JUP slides as downward price move and seller control persist

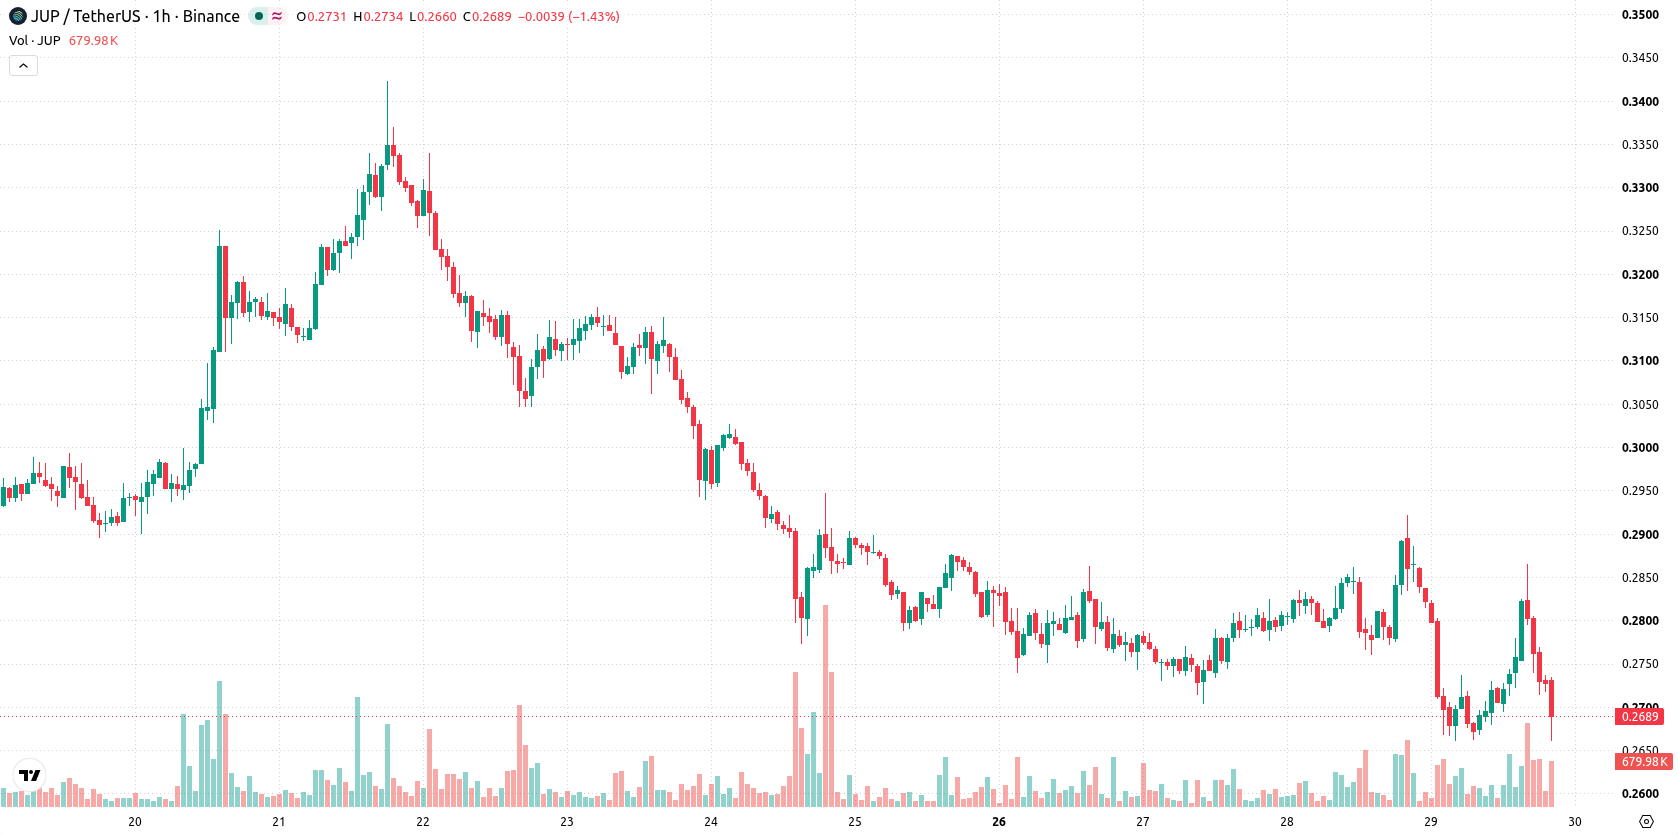
Jupiter (JUP) is trading at $0.2692, reflecting a daily move down of 5.84%. The asset is positioned below its key short- and medium-term moving averages while maintaining footing above longer-term trend levels.
 0.2592
0.2922
Highlights
- Jupiter partnered with BitGo to allow institutional clients to stake Solana directly from BitGo custody without removing assets from cold storage.
- The integration aims to lower operational and custody barriers for institutional DeFi engagement, but Solana price faces ongoing selling pressure.
- JUP/USD faces strong bearish momentum, with a likely price range of $0.2549 to $0.2795 over the next 2 to 3 days.
Institutional staking flows rise as cold-storage integration expands
Jupiter has announced a partnership with BitGo to launch a validator that enables institutional clients to stake Solana directly from their BitGo custody accounts without requiring the movement of assets out of cold storage, according to Coinfomania. This collaboration provides a new channel for institutional participation in DeFi by reducing operational barriers and custody risks for large holders. While the integration addresses a key demand for secure, on-platform staking access, price action has remained under broader selling pressure.
Bearish momentum persists as technical levels cap upside
On the hourly chart, JUP/USD is trading below both the MA-20 and MA-50 levels. However, on the daily timeframe, it remains above the MA-200, reflecting the preservation of a long-term uptrend structure. Immediate resistance is identified at the Ichimoku Kijun level of $0.2791, while support is defined at $0.2549. Among key indicators, MACD signals Strong Sell, highlighting rising bearish momentum, and ADX remains Neutral, indicating a lack of decisive trend strength. The RSI sits at 44.66 (Sell), with Stoch RSI and CCI both Neutral, underscoring mild bearish momentum but no clear oversold or overbought signal. Bull/Bear Power points to seller dominance intraday, and the Awesome Oscillator is Neutral, suggesting mixed short-term momentum.
Range-bound trade likely as bullish breakout odds diminish
For the next 2 to 3 trading days, JUP/USD is expected to trade within a typical volatility band from $0.2549 to $0.2795. A break and sustained move above the $0.2791 resistance would mark the onset of a bullish scenario, while downside risk intensifies if price falls below the $0.2549 support. The most probable short-term scenario is for the asset to remain range-bound within this corridor, with low probability for a decisive upward move and strong likelihood of further downside or sideways action.
Earlier, analysts noted that Jupiter was experiencing ongoing short-term selling pressure despite positive developments such as integrations and buyback mechanisms. The latest institutional integration with BitGo continues to add utility but has yet to shift prevailing momentum, leaving traders to monitor the key $0.2791 resistance for signs of a breakout or $0.2549 support for increased downside risk in the near term.










-
 Afghanistan
-
 Albania
-
 Algeria
-
 Angola
-
 Argentina
-
 Armenia
-
 Australia
-
 Austria
-
 Azerbaijan
-
 Bahamas
-
 Bahrain
-
 Bangladesh
-
 Belarus
-
 Belgium
-
 Bolivia
-
 Botswana
-
 Brazil
-
 Brunei
-
 Bulgaria
-
 Cambodia
-
 Cameroon
-
 Canada
-
 Chile
-
 China
-
 Colombia
-
 Congo
-
 Costa Rica
-
 Cote d'Ivoire
-
 Croatia
-
 Cuba
-
 Cyprus
-
 Czechia
-
 DR Congo
-
 Denmark
-
 Dominican Republic
-
 Ecuador
-
 Egypt
-
 El Salvador
-
 Estonia
-
 Eswatini
-
 Ethiopia
-
 Finland
-
 France
-
 Georgia
-
 Germany
-
 Ghana
-
 Greece
-
 Haiti
-
 Hong Kong
-
 Hungary
-
 India
-
 Indonesia
-
 Iran, Islamic republic
-
 Iraq
-
 Ireland
-
 Israel
-
 Italy
-
 Jamaica
-
 Japan
-
 Jordan
-
 Kazakhstan
-
 Kenya
-
 Korea
-
 Kuwait
-
 Kyrgyzstan
-
 Laos
-
 Latvia
-
 Lebanon
-
 Lesotho
-
 Libya
-
 Lithuania
-
 Luxembourg
-
 Madagascar
-
 Malaysia
-
 Malta
-
 Mauritius
-
 Mexico
-
 Moldova
-
 Mongolia
-
 Montenegro
-
 Morocco
-
 Mozambique
-
 Myanmar
-
 Namibia
-
 Nepal
-
 Netherlands
-
 New Zealand
-
 Nigeria
-
 North Macedonia
-
 Norway
-
 Oman
-
 Pakistan
-
 Palestine
-
 Panama
-
 Papua New Guinea
-
 Paraguay
-
 Peru
-
 Philippines
-
 Poland
-
 Portugal
-
 Puerto Rico
-
 Qatar
-
 Reunion
-
 Romania
-
 Rwanda
-
 Saudi Arabia
-
 Serbia
-
 Singapore
-
 Slovakia
-
 Slovenia
-
 Somalia
-
 South Africa
-
 Spain
-
 Sri Lanka
-
 Sweden
-
 Switzerland
-
 Syria
-
 Taiwan
-
 Tajikistan
-
 Tanzania
-
 Thailand
-
 Trinidad and Tobago
-
 Tunisia
-
 Turkey
-
 UAE
-
 Uganda
-
 Ukraine
-
 United Kingdom
-
United States
-
 Uruguay
-
 Uzbekistan
-
 Venezuela
-
 Vietnam
-
 Yemen
-
 Zambia
-
 Zimbabwe
- Forex
- Crypto












