

FLOW slumps as seller pressure intensifies across all timeframes

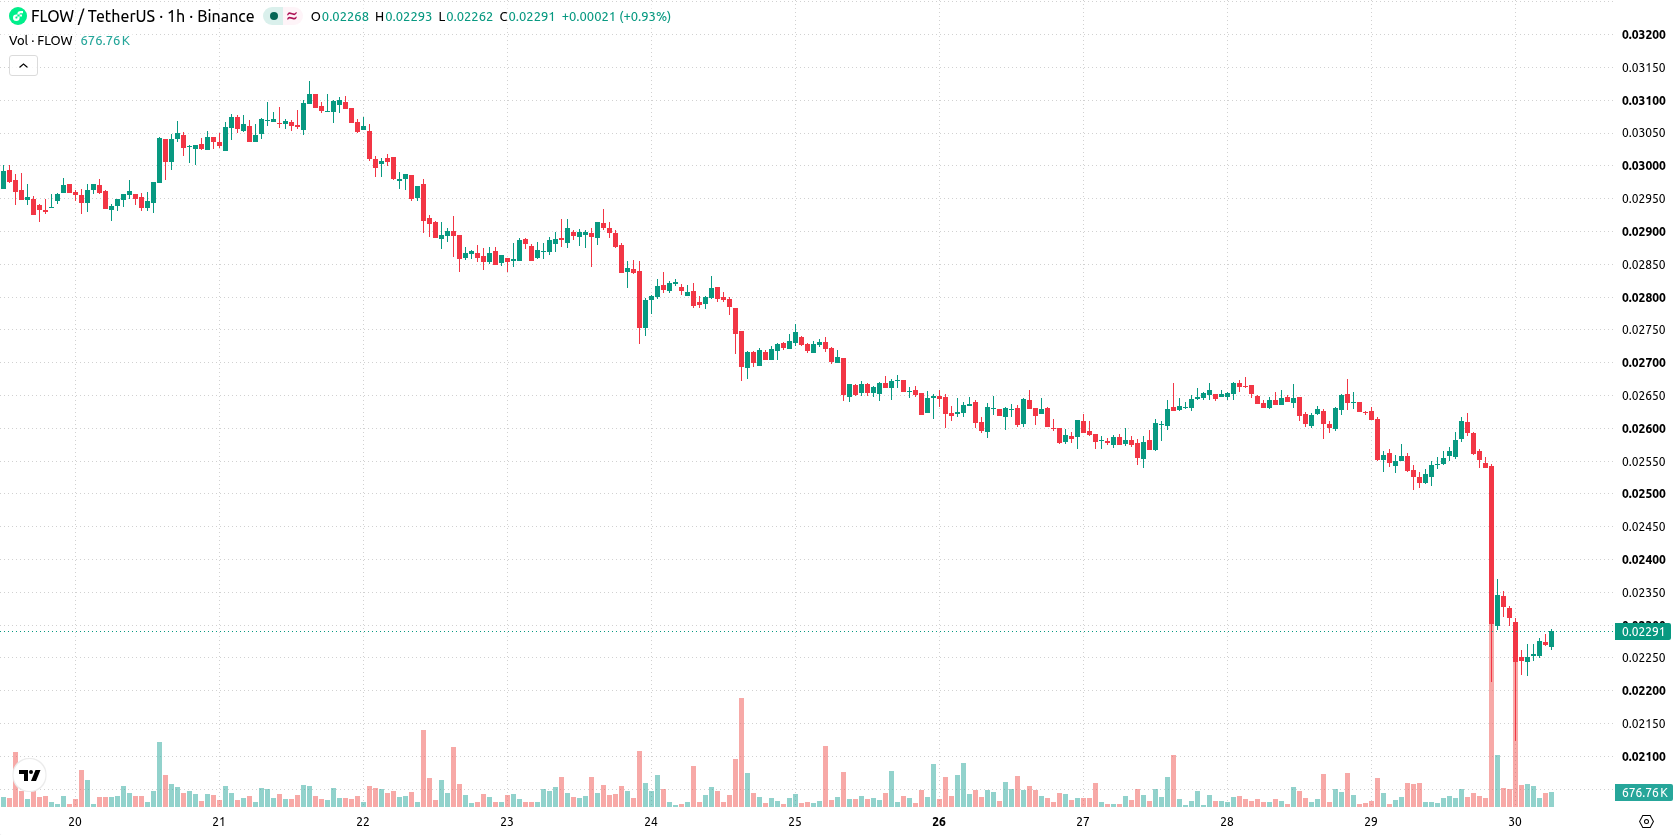
Flow (FLOW) is trading at $0.0228 after a sharp daily drop of 10.26%. The asset currently sits below its key moving averages, reflecting firm downside control.
 0.0159
0.0204
Highlights
- FLOW/USD remains in a clear downtrend, trading below short- and long-term moving averages with sellers controlling all timeframes.
- Bearish momentum persists as momentum indicators collectively signal selling pressure, with some pointing to oversold conditions but no confirmed reversal.
- Expected trading range for the next two to three sessions is $0.0214 to $0.0242, with downside moves much more likely if $0.0214 support breaks.
Selling dominates as indicators confirm momentum loss and resistance
On the hourly chart, FLOW/USD is positioned below the MA-20 and MA-50, with price also remaining well beneath the long-term MA-200, indicating persistent selling across all timeframes. The Ichimoku Kijun level at $0.0237 is acting as immediate resistance for near-term rallies. Momentum indicators are overwhelmingly negative: MACD and ADX both point to continued selling, the RSI reads 27.67 (Sell signal), CCI also signals Sell, and Bull/Bear Power suggests sellers are dominating intraday trading. Stoch RSI is Neutral, and the Awesome Oscillator is also Neutral, reflecting oversold conditions without a confirmed reversal.
Further declines likely as resistance caps potential rebound
Looking ahead to the next two to three sessions, FLOW/USD is expected to trade within a range of $0.0214 to $0.0242. The probability of a further downward move is very high, while any recovery attempt is likely to encounter stiff resistance at $0.0237. If price manages a close above this resistance, short-term upside could follow. Conversely, a loss of the $0.0214 support would likely trigger additional declines and further extend the broad downtrend, with selling pressure remaining the baseline scenario.
Previously it was reported that Flow was exhibiting persistent technical weakness and sustained bearish momentum. Recent price action and indicator data reinforce this view, with continued downside control suggesting traders should closely monitor the $0.0214 support level for signs of further declines.










-
 Afghanistan
-
 Albania
-
 Algeria
-
 Angola
-
 Argentina
-
 Armenia
-
 Australia
-
 Austria
-
 Azerbaijan
-
 Bahamas
-
 Bahrain
-
 Bangladesh
-
 Belarus
-
 Belgium
-
 Bolivia
-
 Botswana
-
 Brazil
-
 Brunei
-
 Bulgaria
-
 Cambodia
-
 Cameroon
-
 Canada
-
 Chile
-
 China
-
 Colombia
-
 Congo
-
 Costa Rica
-
 Cote d'Ivoire
-
 Croatia
-
 Cuba
-
 Cyprus
-
 Czechia
-
 DR Congo
-
 Denmark
-
 Dominican Republic
-
 Ecuador
-
 Egypt
-
 El Salvador
-
 Estonia
-
 Eswatini
-
 Ethiopia
-
 Finland
-
 France
-
 Georgia
-
 Germany
-
 Ghana
-
 Greece
-
 Haiti
-
 Hong Kong
-
 Hungary
-
 India
-
 Indonesia
-
 Iran, Islamic republic
-
 Iraq
-
 Ireland
-
 Israel
-
 Italy
-
 Jamaica
-
 Japan
-
 Jordan
-
 Kazakhstan
-
 Kenya
-
 Korea
-
 Kuwait
-
 Kyrgyzstan
-
 Laos
-
 Latvia
-
 Lebanon
-
 Lesotho
-
 Libya
-
 Lithuania
-
 Luxembourg
-
 Madagascar
-
 Malaysia
-
 Malta
-
 Mauritius
-
 Mexico
-
 Moldova
-
 Mongolia
-
 Montenegro
-
 Morocco
-
 Mozambique
-
 Myanmar
-
 Namibia
-
 Nepal
-
 Netherlands
-
 New Zealand
-
 Nigeria
-
 North Macedonia
-
 Norway
-
 Oman
-
 Pakistan
-
 Palestine
-
 Panama
-
 Papua New Guinea
-
 Paraguay
-
 Peru
-
 Philippines
-
 Poland
-
 Portugal
-
 Puerto Rico
-
 Qatar
-
 Reunion
-
 Romania
-
 Rwanda
-
 Saudi Arabia
-
 Serbia
-
 Singapore
-
 Slovakia
-
 Slovenia
-
 Somalia
-
 South Africa
-
 Spain
-
 Sri Lanka
-
 Sweden
-
 Switzerland
-
 Syria
-
 Taiwan
-
 Tajikistan
-
 Tanzania
-
 Thailand
-
 Trinidad and Tobago
-
 Tunisia
-
 Turkey
-
 UAE
-
 Uganda
-
 Ukraine
-
 United Kingdom
-
United States
-
 Uruguay
-
 Uzbekistan
-
 Venezuela
-
 Vietnam
-
 Yemen
-
 Zambia
-
 Zimbabwe
- Forex
- Crypto












