

Celestia falls as short-term sellers keep control

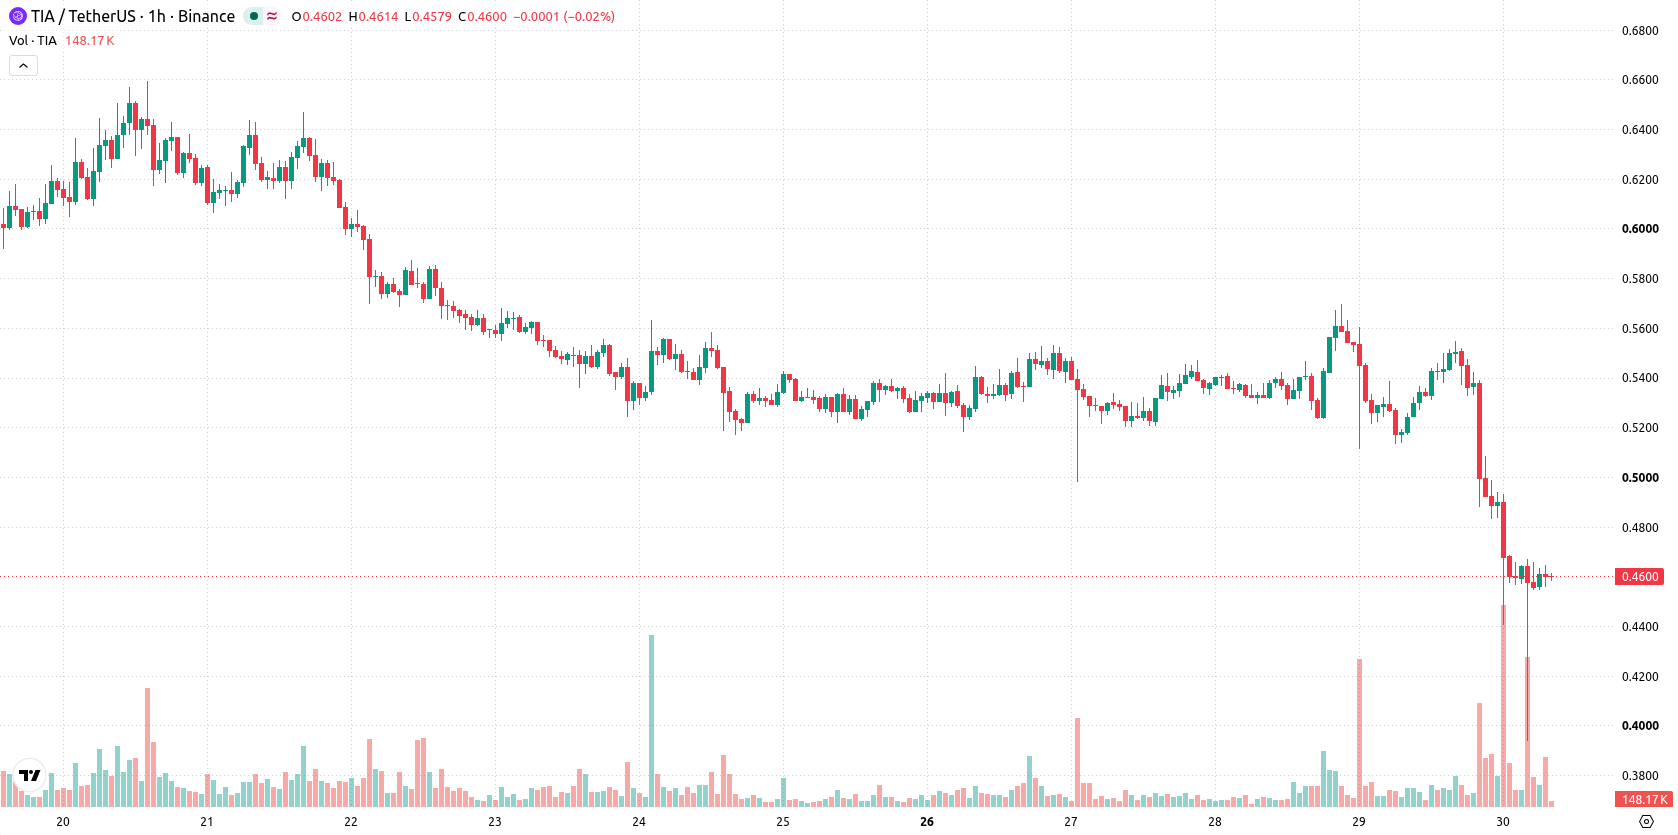
Celestia (TIA) is trading at $0.4599, down 11.27% on the day. The asset currently sits below its key short- and medium-term moving averages, reflecting pronounced negative momentum for this session.
 0.3615
0.4800
Highlights
- Celestia Labs introduced Voyager, a blockchain architecture for AI agent payments, reaching over 21 million transactions per second in one-node tests.
- The Voyager product is not yet live, but its technical performance brings renewed attention to Celestia's network scalability.
- TIA/USD has dropped 11.27% today, trades below short and medium-term moving averages, and is projected to consolidate within $0.4405 to $0.4793 as strong selling dominates.
High-throughput architecture unveiling offsets selling pressure for Celestia
Celestia Labs recently unveiled Voyager, its blockchain architecture targeting payments for AI agents, which achieved over 21 million transactions per second in a single-node benchmark test, according to Kucoin. This demonstration of technical capability highlights a focus on high throughput solutions within Celestia's development strategy. Although this product is not yet live, its unveiling could spark renewed interest in the project's network scalability, though price action has remained under broader selling pressure.
Intraday oversold signals emerge as TIA tests multiple resistance levels
On the technical front, TIA/USD is trading below the MA-20 at $0.5003 and the MA-50 at $0.5218 on the H1 chart, while remaining above the daily MA-200 support at $0.3999. The Ichimoku Kijun is positioned at $0.4742, providing immediate resistance. Among momentum indicators, MACD, ADX, RSI, CCI, and Bull/Bear Power all signal strong selling conditions, while Stoch RSI and Awesome Oscillator are neutral. RSI at 26.45 confirms intraday oversold conditions, with CCI and Bull/Bear Power likewise pointing to firm seller dominance and heightened downside volatility.
Downside bias persists while rangebound action dominates short-term outlook
Looking ahead to the next 2-3 trading days, TIA is expected to consolidate within a range of $0.4405 to $0.4793, with a strong likelihood of further downside movement and limited scope for sustained recovery. The baseline case suggests sideways movement between these levels. Should price decisively break above the Ichimoku Kijun resistance at $0.4742, a short-covering rally could occur towards the upper edge of the range. Conversely, a break below $0.4405 would likely see bears attempt to establish new lows within an ongoing volatile session.
Earlier, analysts noted that Celestia faced ongoing bearish momentum and increased volatility despite continued network developments. The latest technical setup indicates that traders should closely monitor the $0.4742 resistance and $0.4405 support, as decisive moves beyond these levels could dictate the direction of TIA's next significant shift.










-
 Afghanistan
-
 Albania
-
 Algeria
-
 Angola
-
 Argentina
-
 Armenia
-
 Australia
-
 Austria
-
 Azerbaijan
-
 Bahamas
-
 Bahrain
-
 Bangladesh
-
 Belarus
-
 Belgium
-
 Bolivia
-
 Botswana
-
 Brazil
-
 Brunei
-
 Bulgaria
-
 Cambodia
-
 Cameroon
-
 Canada
-
 Chile
-
 China
-
 Colombia
-
 Congo
-
 Costa Rica
-
 Cote d'Ivoire
-
 Croatia
-
 Cuba
-
 Cyprus
-
 Czechia
-
 DR Congo
-
 Denmark
-
 Dominican Republic
-
 Ecuador
-
 Egypt
-
 El Salvador
-
 Estonia
-
 Eswatini
-
 Ethiopia
-
 Finland
-
 France
-
 Georgia
-
 Germany
-
 Ghana
-
 Greece
-
 Haiti
-
 Hong Kong
-
 Hungary
-
 India
-
 Indonesia
-
 Iran, Islamic republic
-
 Iraq
-
 Ireland
-
 Israel
-
 Italy
-
 Jamaica
-
 Japan
-
 Jordan
-
 Kazakhstan
-
 Kenya
-
 Korea
-
 Kuwait
-
 Kyrgyzstan
-
 Laos
-
 Latvia
-
 Lebanon
-
 Lesotho
-
 Libya
-
 Lithuania
-
 Luxembourg
-
 Madagascar
-
 Malaysia
-
 Malta
-
 Mauritius
-
 Mexico
-
 Moldova
-
 Mongolia
-
 Montenegro
-
 Morocco
-
 Mozambique
-
 Myanmar
-
 Namibia
-
 Nepal
-
 Netherlands
-
 New Zealand
-
 Nigeria
-
 North Macedonia
-
 Norway
-
 Oman
-
 Pakistan
-
 Palestine
-
 Panama
-
 Papua New Guinea
-
 Paraguay
-
 Peru
-
 Philippines
-
 Poland
-
 Portugal
-
 Puerto Rico
-
 Qatar
-
 Reunion
-
 Romania
-
 Rwanda
-
 Saudi Arabia
-
 Serbia
-
 Singapore
-
 Slovakia
-
 Slovenia
-
 Somalia
-
 South Africa
-
 Spain
-
 Sri Lanka
-
 Sweden
-
 Switzerland
-
 Syria
-
 Taiwan
-
 Tajikistan
-
 Tanzania
-
 Thailand
-
 Trinidad and Tobago
-
 Tunisia
-
 Turkey
-
 UAE
-
 Uganda
-
 Ukraine
-
 United Kingdom
-
United States
-
 Uruguay
-
 Uzbekistan
-
 Venezuela
-
 Vietnam
-
 Yemen
-
 Zambia
-
 Zimbabwe
- Forex
- Crypto












