


Celestia (TIA) dropped 13.45% after heavy selling set in, even as investor attention remained focused on new product developments. The magnitude of the decline is supported by TIA trading below its short- and medium-term moving averages, with sellers controlling near-term price action.
 0.4479
0.5697
Highlights
- Celestia unveiled Voyager, a modular blockchain execution layer for high-throughput AI agent payments, processing 21.2 million transactions per second in controlled testing.
- Voyager is still under development and has not launched on mainnet, with much of Binary Builders team joining Celestia for integration.
- TIA/USD remains under strong short- and medium-term selling pressure, with trading projected to range between $0.4063 and $0.4997 over the next five days.
Product upgrades draw team integration as price lags high-throughput claims
Celestia announced and demonstrated Voyager, a modular blockchain execution layer engineered for high-throughput AI agent payments. In a single-node benchmark, Voyager was reported to process 21.2 million transactions per second over 100 million accounts in a controlled environment, with transaction fees settled in TIA. Voyager remains under active development and has not yet launched on mainnet. Most of the Binary Builders team will join Celestia as part of integration efforts, though price action has remained under broader selling pressure.
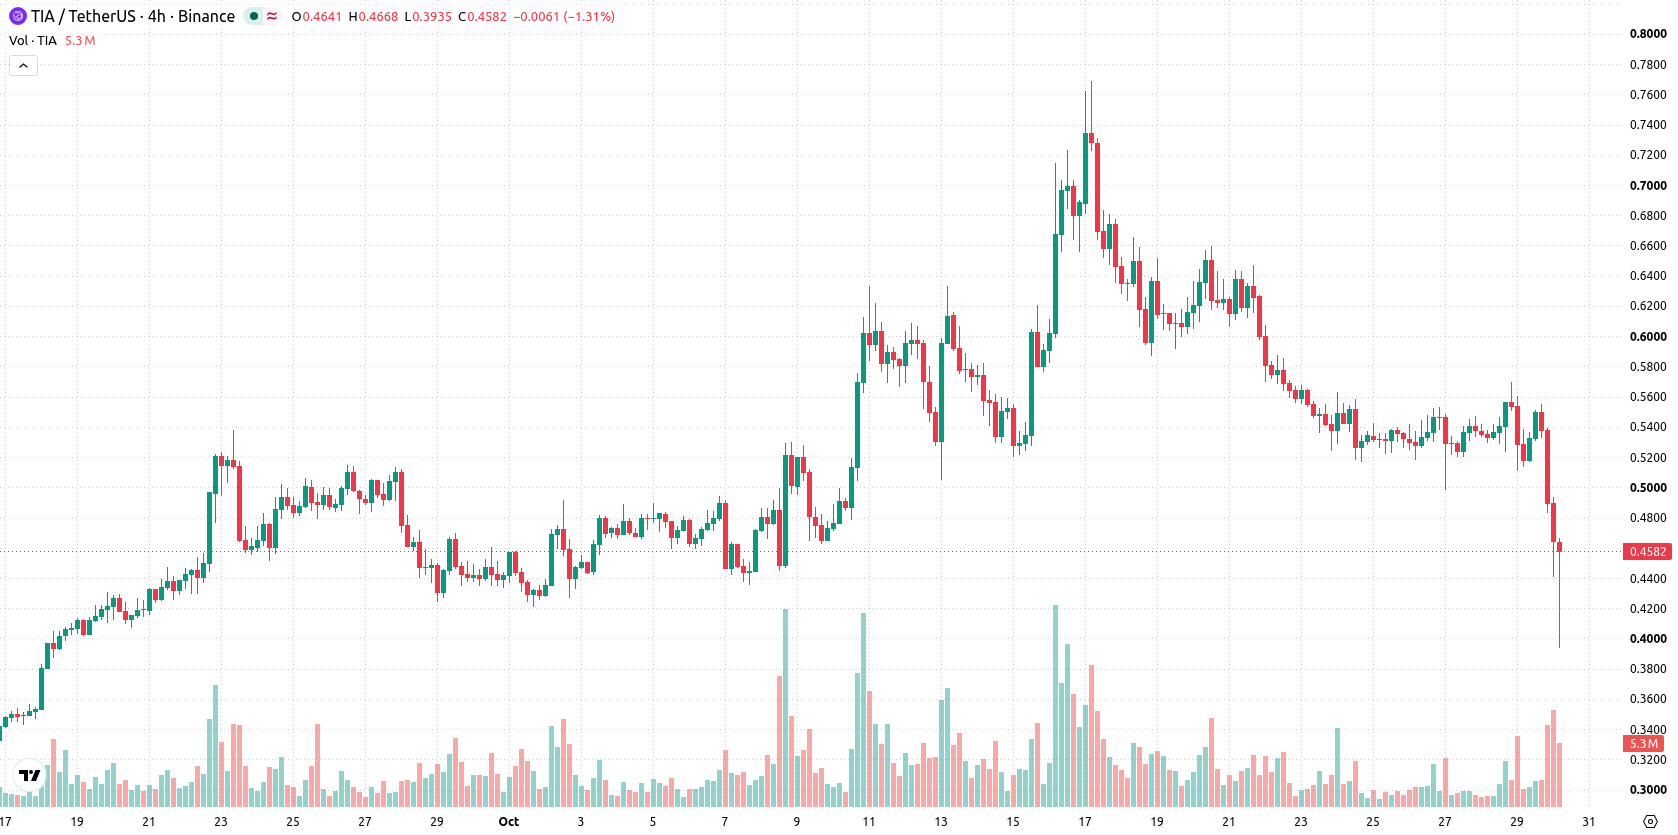
Mixed momentum amid long-term support and near-term downside,
TIA/USD is now trading below both the 20-day and 50-day moving averages at $0.5789 and $0.4921, but remains above the 200-day at $0.3999. This configuration indicates ongoing short- and medium-term pressure from sellers, yet preserves a bullish long-term trend with the 50-day average positioned above the 200-day. The near-term ceiling is situated at $0.4829, while immediate support is at $0.4404. Momentum indicators show mixed signals. The Moving Average Convergence Divergence (MACD) and Average Directional Index (ADX) both point to positive energy, suggesting lingering buy-side strength. However, the Relative Strength Index (RSI), Commodity Channel Index (CCI), and Hull Moving Average (HMA) flag selling signals, with the Stochastic RSI deeply oversold at zero. Bull/Bear Power (BBP) is marginally positive, implying buyers have a slight intraday advantage, yet the overall tone is subdued. The pair fell $0.0709 or 13.45% at the latest tick, opening with a downside gap of about 7.09% and is trading near the lower end of today’s range. Intraday volatility stands at 12.01%, reflecting heavy pressure after the open. The divergence among oscillators and momentum indicators highlights split sentiment, with price action confirming prevailing seller control.
Earlier, analysts noted that Celestia faced ongoing bearish momentum and heightened volatility despite continued network developments and new product announcements. The latest technical readings and price action reinforce this short- and medium-term downside pressure, making the $0.4404 support level pivotal for traders assessing near-term direction.










-
 Afghanistan
-
 Albania
-
 Algeria
-
 Angola
-
 Argentina
-
 Armenia
-
 Australia
-
 Austria
-
 Azerbaijan
-
 Bahamas
-
 Bahrain
-
 Bangladesh
-
 Belarus
-
 Belgium
-
 Bolivia
-
 Botswana
-
 Brazil
-
 Brunei
-
 Bulgaria
-
 Cambodia
-
 Cameroon
-
 Canada
-
 Chile
-
 China
-
 Colombia
-
 Congo
-
 Costa Rica
-
 Cote d'Ivoire
-
 Croatia
-
 Cuba
-
 Cyprus
-
 Czechia
-
 DR Congo
-
 Denmark
-
 Dominican Republic
-
 Ecuador
-
 Egypt
-
 El Salvador
-
 Estonia
-
 Eswatini
-
 Ethiopia
-
 Finland
-
 France
-
 Georgia
-
 Germany
-
 Ghana
-
 Greece
-
 Haiti
-
 Hong Kong
-
 Hungary
-
 India
-
 Indonesia
-
 Iran, Islamic republic
-
 Iraq
-
 Ireland
-
 Israel
-
 Italy
-
 Jamaica
-
 Japan
-
 Jordan
-
 Kazakhstan
-
 Kenya
-
 Korea
-
 Kuwait
-
 Kyrgyzstan
-
 Laos
-
 Latvia
-
 Lebanon
-
 Lesotho
-
 Libya
-
 Lithuania
-
 Luxembourg
-
 Madagascar
-
 Malaysia
-
 Malta
-
 Mauritius
-
 Mexico
-
 Moldova
-
 Mongolia
-
 Montenegro
-
 Morocco
-
 Mozambique
-
 Myanmar
-
 Namibia
-
 Nepal
-
 Netherlands
-
 New Zealand
-
 Nigeria
-
 North Macedonia
-
 Norway
-
 Oman
-
 Pakistan
-
 Palestine
-
 Panama
-
 Papua New Guinea
-
 Paraguay
-
 Peru
-
 Philippines
-
 Poland
-
 Portugal
-
 Puerto Rico
-
 Qatar
-
 Reunion
-
 Romania
-
 Rwanda
-
 Saudi Arabia
-
 Serbia
-
 Singapore
-
 Slovakia
-
 Slovenia
-
 Somalia
-
 South Africa
-
 Spain
-
 Sri Lanka
-
 Sweden
-
 Switzerland
-
 Syria
-
 Taiwan
-
 Tajikistan
-
 Tanzania
-
 Thailand
-
 Trinidad and Tobago
-
 Tunisia
-
 Turkey
-
 UAE
-
 Uganda
-
 Ukraine
-
 United Kingdom
-
United States
-
 Uruguay
-
 Uzbekistan
-
 Venezuela
-
 Vietnam
-
 Yemen
-
 Zambia
-
 Zimbabwe
- Forex
- Crypto












