

Plasma upward price move as buyer support and momentum remain strong

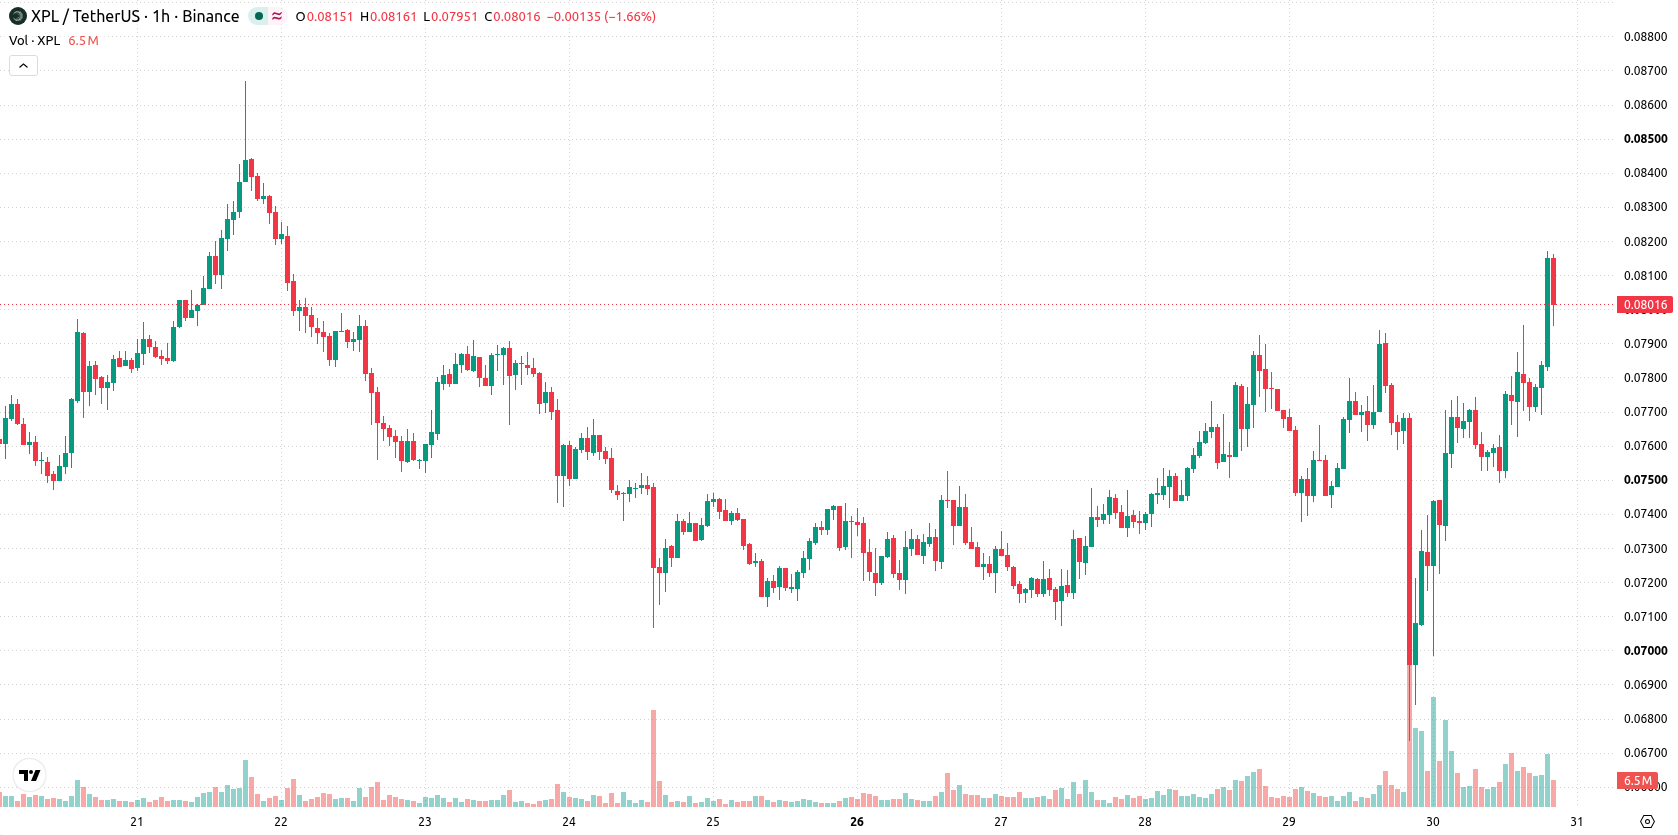
Plasma (XPL) is trading at $0.0803, up 7.76% for the session and holding above its key moving averages, with price activity showing strong momentum on elevated volatility.
 0.0465
0.0523
Highlights
- Plasma trading volume is up 58.53% above its 30-day average, showing increased market activity and liquidity.
- Plasma's market capitalization stands at $363.17 million, indicating its scale and potential liquidity support.
- Technical signals are mixed with bullish short-term momentum and overbought conditions, projecting a trading range of $0.075 to $0.083 over the next 2 to 3 days.
Liquidity rises as above-average volumes attract active trader engagement
Trading volume for Plasma is currently 58.53% above the 30-day average, indicating a notable increase in market activity and liquidity that can amplify price movement and support the current buying interest. According to the reported figures, this elevated engagement within the market environment may attract further participation or signal greater conviction among active traders. The project’s market capitalization stands at approximately $363.17 million, offering insight into its relative scale and potential liquidity foundation.
Medium-term buyer dominance as long-term resistance and indicator divergence persist
On the technical front, XPL/USD holds above its MA-20 and MA-50 but remains below its MA-200 on the daily timeframe, reflecting ongoing medium-term buyer support with longer-term resistance. Immediate support is defined by the Ichimoku Kijun at $0.0734. MACD continues to indicate buying pressure, while ADX remains neutral. The RSI reads bullish at 60, yet both Stochastic RSI and CCI signal overbought conditions, cautioning that upward momentum could be nearing exhaustion. Bull/Bear Power favors buyers intraday, but the Awesome Oscillator is neutral, suggesting not all momentum indicators are in alignment.
Range-bound outlook as bullish bias faces resistance and correction risk
Over the next two to three trading days, XPL is likely to trade within the $0.075 to $0.083 band, reflecting typical volatility relative to current levels. The probability of further upside is classified as very high, with a downward move deemed much less likely. The baseline scenario involves sideways consolidation between defined support and resistance. Should bullish momentum prevail, price could break above immediate resistance, while any drop below the $0.0734 Kijun support may trigger a broader corrective phase.
Previously it was reported that stabilizing supply dynamics and emerging upside momentum placed attention on the potential for a sustained trend reversal in Plasma. With the latest surge in trading activity and continued buying pressure, the focus now shifts to whether elevated liquidity can power a move beyond current resistance, making breakout confirmation above recent highs the key level to monitor.






Latest Plasma News




-
 Afghanistan
-
 Albania
-
 Algeria
-
 Angola
-
 Argentina
-
 Armenia
-
 Australia
-
 Austria
-
 Azerbaijan
-
 Bahamas
-
 Bahrain
-
 Bangladesh
-
 Belarus
-
 Belgium
-
 Bolivia
-
 Botswana
-
 Brazil
-
 Brunei
-
 Bulgaria
-
 Cambodia
-
 Cameroon
-
 Canada
-
 Chile
-
 China
-
 Colombia
-
 Congo
-
 Costa Rica
-
 Cote d'Ivoire
-
 Croatia
-
 Cuba
-
 Cyprus
-
 Czechia
-
 DR Congo
-
 Denmark
-
 Dominican Republic
-
 Ecuador
-
 Egypt
-
 El Salvador
-
 Estonia
-
 Eswatini
-
 Ethiopia
-
 Finland
-
 France
-
 Georgia
-
 Germany
-
 Ghana
-
 Greece
-
 Haiti
-
 Hong Kong
-
 Hungary
-
 India
-
 Indonesia
-
 Iran, Islamic republic
-
 Iraq
-
 Ireland
-
 Israel
-
 Italy
-
 Jamaica
-
 Japan
-
 Jordan
-
 Kazakhstan
-
 Kenya
-
 Korea
-
 Kuwait
-
 Kyrgyzstan
-
 Laos
-
 Latvia
-
 Lebanon
-
 Lesotho
-
 Libya
-
 Lithuania
-
 Luxembourg
-
 Madagascar
-
 Malaysia
-
 Malta
-
 Mauritius
-
 Mexico
-
 Moldova
-
 Mongolia
-
 Montenegro
-
 Morocco
-
 Mozambique
-
 Myanmar
-
 Namibia
-
 Nepal
-
 Netherlands
-
 New Zealand
-
 Nigeria
-
 North Macedonia
-
 Norway
-
 Oman
-
 Pakistan
-
 Palestine
-
 Panama
-
 Papua New Guinea
-
 Paraguay
-
 Peru
-
 Philippines
-
 Poland
-
 Portugal
-
 Puerto Rico
-
 Qatar
-
 Reunion
-
 Romania
-
 Rwanda
-
 Saudi Arabia
-
 Serbia
-
 Singapore
-
 Slovakia
-
 Slovenia
-
 Somalia
-
 South Africa
-
 Spain
-
 Sri Lanka
-
 Sweden
-
 Switzerland
-
 Syria
-
 Taiwan
-
 Tajikistan
-
 Tanzania
-
 Thailand
-
 Trinidad and Tobago
-
 Tunisia
-
 Turkey
-
 UAE
-
 Uganda
-
 Ukraine
-
 United Kingdom
-
United States
-
 Uruguay
-
 Uzbekistan
-
 Venezuela
-
 Vietnam
-
 Yemen
-
 Zambia
-
 Zimbabwe
- Forex
- Crypto












