

Aave faces negative momentum with high volatility as immediate support holds watch: weekly analysis

Aave (AAVE) is trading near $132 after falling by nearly 8% over the past week, as a steep downward move puts technical support levels in focus. Momentum indicators remain negative, although some signals are hinting at potential selling fatigue, making next week's support tests more consequential for direction.
 141.17
138.77
Highlights
- Aave trades at $131.81 with a 7.82% decline over the past 7 days, showing sustained downward momentum.
- Price stays below key moving averages with both MACD and ADX confirming ongoing selling pressure and a firm bearish trend.
- Aave is expected to fluctuate between $119.22 and $155.86 over the next week, with $115.23 as immediate support and $139.02 as resistance.
Exchange freezes and security incident drive sentiment alongside new Chainlink partnership
Aave froze all V3 and V4 markets this week as a precaution after a Binance hot wallet was compromised, with the attacker depositing $60 million USDT as collateral and borrowing 19,762 WETH, according to TechFlowPost. Aave’s official X account stated that contracts were unaffected and positions remained secure, but new deposits and borrowing were paused until all markets were fully unfrozen on October 30, as reported by TokenPost. Nine assets, including USDT and USDC, are still not eligible to back new borrowing, while a new partnership with Chainlink will bring 24/7 real-world asset pricing for institutional lending and operations on the Horizon platform, The Defiant reported (source: TokenPost).
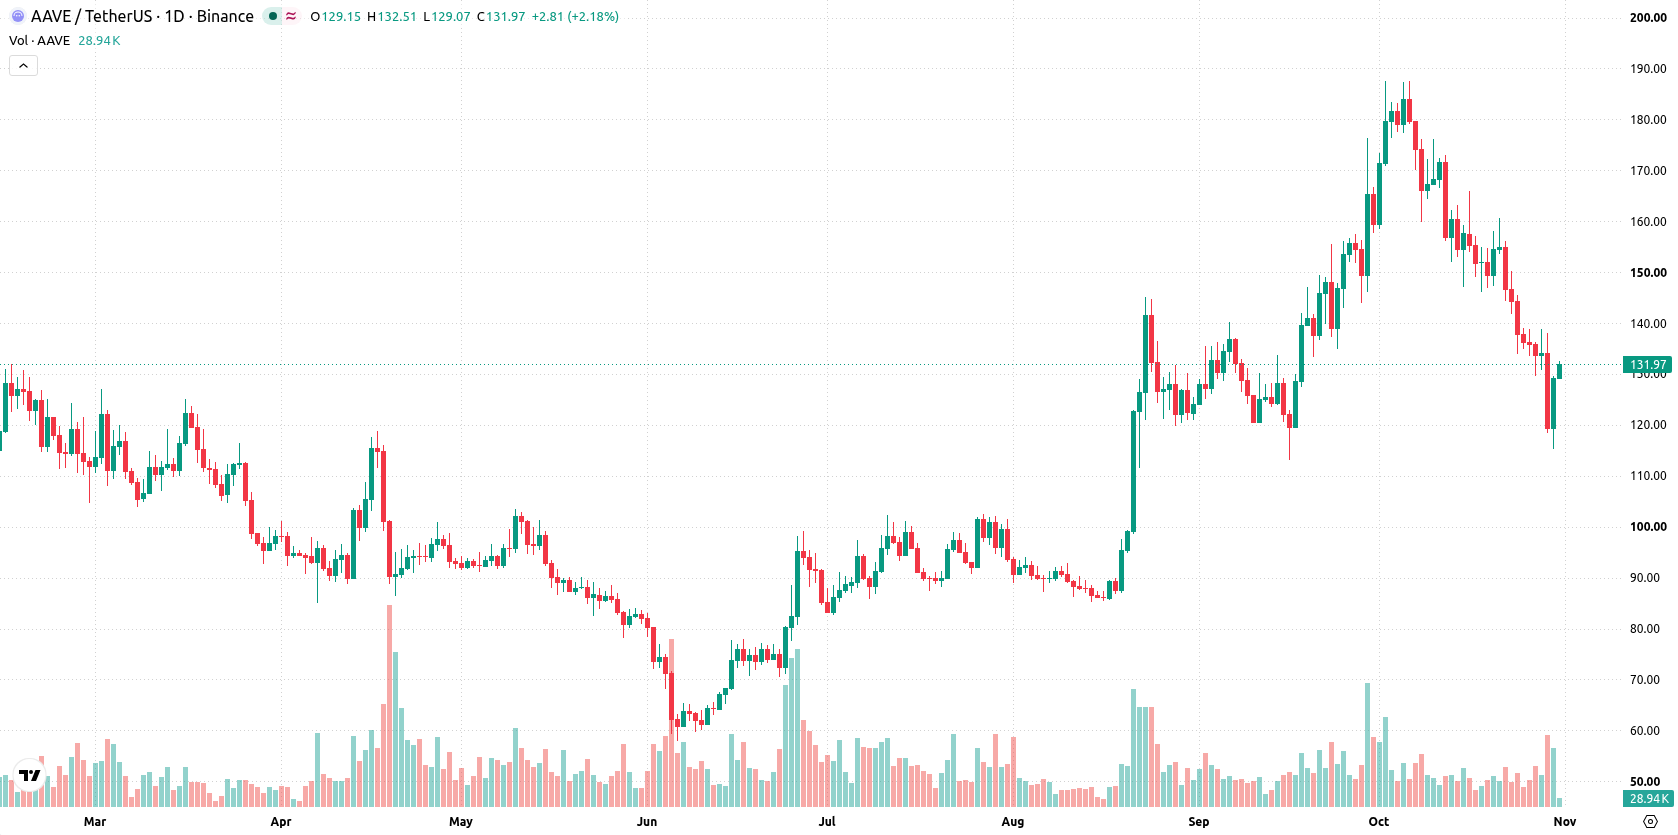
Oversold signals develop as downside momentum dominates this week’s chart setup
The daily chart shows a sustained move lower with a firm trend, accompanied by high volatility at 20.65%. CCI is in the oversold zone at -150.43, flagging potential selling exhaustion, while RSI is neutral at 35.25. MACD and ADX both indicate selling pressure, reinforcing the current downward momentum. Immediate support is at $115.23 and resistance is noted at $139.02, with the Ichimoku Kijun at $151.41 acting as additional resistance.
Breakout risk rises next week as price approaches key range boundaries
Over the next 7 days, Aave is expected to trade between $119.22 and $155.86, with a 38% probability of an increase and a 62% probability of a decrease. The base scenario sees price fluctuating within this range, capped by resistance near $139.02. A move above $139.02 could open a test of the upper bound at $155.86. If price breaks below $115.23, the lower range near $119.22 becomes the next focus for sellers.
Earlier, analysts emphasized elevated downside risk and ongoing consolidation for Aave following security-related market freezes. The current analysis not only reaffirms persistent downside pressure but also highlights heightened volatility, with the $115.23 support level now serving as a critical threshold for short-term direction.






Latest AAVE News




-
 Afghanistan
-
 Albania
-
 Algeria
-
 Angola
-
 Argentina
-
 Armenia
-
 Australia
-
 Austria
-
 Azerbaijan
-
 Bahamas
-
 Bahrain
-
 Bangladesh
-
 Belarus
-
 Belgium
-
 Bolivia
-
 Botswana
-
 Brazil
-
 Brunei
-
 Bulgaria
-
 Cambodia
-
 Cameroon
-
 Canada
-
 Chile
-
 China
-
 Colombia
-
 Congo
-
 Costa Rica
-
 Cote d'Ivoire
-
 Croatia
-
 Cuba
-
 Cyprus
-
 Czechia
-
 DR Congo
-
 Denmark
-
 Dominican Republic
-
 Ecuador
-
 Egypt
-
 El Salvador
-
 Estonia
-
 Eswatini
-
 Ethiopia
-
 Finland
-
 France
-
 Georgia
-
 Germany
-
 Ghana
-
 Greece
-
 Haiti
-
 Hong Kong
-
 Hungary
-
 India
-
 Indonesia
-
 Iran, Islamic republic
-
 Iraq
-
 Ireland
-
 Israel
-
 Italy
-
 Jamaica
-
 Japan
-
 Jordan
-
 Kazakhstan
-
 Kenya
-
 Korea
-
 Kuwait
-
 Kyrgyzstan
-
 Laos
-
 Latvia
-
 Lebanon
-
 Lesotho
-
 Libya
-
 Lithuania
-
 Luxembourg
-
 Madagascar
-
 Malaysia
-
 Malta
-
 Mauritius
-
 Mexico
-
 Moldova
-
 Mongolia
-
 Montenegro
-
 Morocco
-
 Mozambique
-
 Myanmar
-
 Namibia
-
 Nepal
-
 Netherlands
-
 New Zealand
-
 Nigeria
-
 North Macedonia
-
 Norway
-
 Oman
-
 Pakistan
-
 Palestine
-
 Panama
-
 Papua New Guinea
-
 Paraguay
-
 Peru
-
 Philippines
-
 Poland
-
 Portugal
-
 Puerto Rico
-
 Qatar
-
 Reunion
-
 Romania
-
 Rwanda
-
 Saudi Arabia
-
 Serbia
-
 Singapore
-
 Slovakia
-
 Slovenia
-
 Somalia
-
 South Africa
-
 Spain
-
 Sri Lanka
-
 Sweden
-
 Switzerland
-
 Syria
-
 Taiwan
-
 Tajikistan
-
 Tanzania
-
 Thailand
-
 Trinidad and Tobago
-
 Tunisia
-
 Turkey
-
 UAE
-
 Uganda
-
 Ukraine
-
 United Kingdom
-
United States
-
 Uruguay
-
 Uzbekistan
-
 Venezuela
-
 Vietnam
-
 Yemen
-
 Zambia
-
 Zimbabwe
- Forex
- Crypto












