

Sui pressured by negative momentum signals as sellers keep control: weekly analysis

Sui (SUI) is trading near $0.90 after falling almost 6% this week, entering oversold territory as technical momentum remains negative. Conflicting signals point to potential selling exhaustion, leaving the setup finely balanced between further downside and a possible rebound in the days ahead.
 0.9094
0.9650
Highlights
- Sui trades at $0.9017, falling 5.89% in the past week, now below its 20-day and 50-day averages.
- Technical momentum indicators are bearish, with high volatility and signals favoring continued negative pressure in the near term.
- Sui is projected to trade between $0.829 and $0.9743, with $0.8656 as key support and $0.965 as near-term resistance.
Ecosystem expansion accelerates as Mercado Bitcoin and Samsung boost Sui adoption
Sui saw notable ecosystem activity this week as Mercado Bitcoin, a major Brazilian exchange, launched support for Sui transfers, potentially widening the user base according to Coinfomania. New integrations continued, with Cetus AI tools and Samsung Wallet infrastructure supporting USDC, and Navi Protocol unveiling its first EVM vault based on Sui, allowing users to deposit USDC from Ethereum without creating a new wallet (sources: Altcoin Buzz, CoinGabbar). Recent mainnet upgrades and a security release also addressed transaction settlement issues, supporting Sui's ongoing technical expansion.
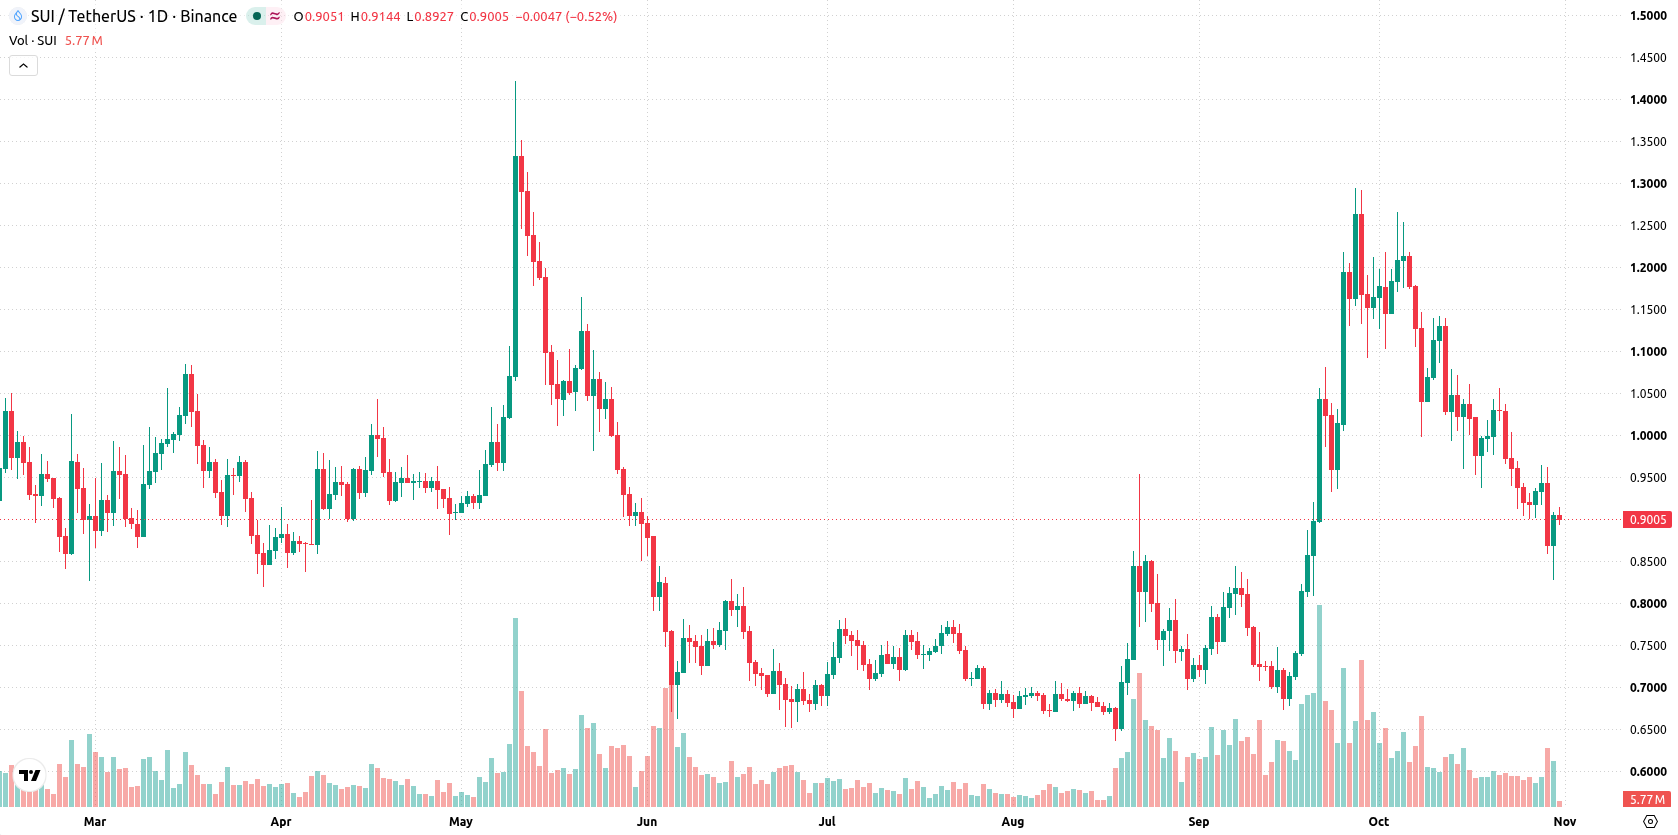
Momentum stays bearish this week as CCI flags possible rebound
The daily chart shows a sharp move lower without a sustained trend, with volatility high at 16.59%. Momentum signals such as MACD and ADX both point down and favor sellers, while CCI is in its oversold zone at -145.1667, flagging possible selling exhaustion and a chance of an upside rebound. Support is found at $0.8656 (the 200-day moving average), with resistance at the recent weekly high of $0.965, and the Ichimoku Kijun at $1.0411 may act as a cap if any bounce develops.
Directional bias stays negative as crucial levels frame next week's range
In the week ahead, Sui is expected to trade between $0.829 and $0.9743. The probability of a decrease is 78% versus a 22% chance of an increase. The base case is a test of the middle of this range as the market digests recent losses. A bullish break above $0.965 could target the Kijun resistance at $1.0411, while a move below $0.8656 would open the door to deeper losses towards the lower end of the forecasted range.
Earlier, analysts noted that Sui remained under significant bearish pressure despite ongoing ecosystem and institutional developments, with downside risks prevailing in the near term. The latest review adds that, while selling exhaustion is being signaled at oversold levels, traders should monitor the $0.8656 support closely for any shift in the prevailing bearish scenario.










-
 Afghanistan
-
 Albania
-
 Algeria
-
 Angola
-
 Argentina
-
 Armenia
-
 Australia
-
 Austria
-
 Azerbaijan
-
 Bahamas
-
 Bahrain
-
 Bangladesh
-
 Belarus
-
 Belgium
-
 Bolivia
-
 Botswana
-
 Brazil
-
 Brunei
-
 Bulgaria
-
 Cambodia
-
 Cameroon
-
 Canada
-
 Chile
-
 China
-
 Colombia
-
 Congo
-
 Costa Rica
-
 Cote d'Ivoire
-
 Croatia
-
 Cuba
-
 Cyprus
-
 Czechia
-
 DR Congo
-
 Denmark
-
 Dominican Republic
-
 Ecuador
-
 Egypt
-
 El Salvador
-
 Estonia
-
 Eswatini
-
 Ethiopia
-
 Finland
-
 France
-
 Georgia
-
 Germany
-
 Ghana
-
 Greece
-
 Haiti
-
 Hong Kong
-
 Hungary
-
 India
-
 Indonesia
-
 Iran, Islamic republic
-
 Iraq
-
 Ireland
-
 Israel
-
 Italy
-
 Jamaica
-
 Japan
-
 Jordan
-
 Kazakhstan
-
 Kenya
-
 Korea
-
 Kuwait
-
 Kyrgyzstan
-
 Laos
-
 Latvia
-
 Lebanon
-
 Lesotho
-
 Libya
-
 Lithuania
-
 Luxembourg
-
 Madagascar
-
 Malaysia
-
 Malta
-
 Mauritius
-
 Mexico
-
 Moldova
-
 Mongolia
-
 Montenegro
-
 Morocco
-
 Mozambique
-
 Myanmar
-
 Namibia
-
 Nepal
-
 Netherlands
-
 New Zealand
-
 Nigeria
-
 North Macedonia
-
 Norway
-
 Oman
-
 Pakistan
-
 Palestine
-
 Panama
-
 Papua New Guinea
-
 Paraguay
-
 Peru
-
 Philippines
-
 Poland
-
 Portugal
-
 Puerto Rico
-
 Qatar
-
 Reunion
-
 Romania
-
 Rwanda
-
 Saudi Arabia
-
 Serbia
-
 Singapore
-
 Slovakia
-
 Slovenia
-
 Somalia
-
 South Africa
-
 Spain
-
 Sri Lanka
-
 Sweden
-
 Switzerland
-
 Syria
-
 Taiwan
-
 Tajikistan
-
 Tanzania
-
 Thailand
-
 Trinidad and Tobago
-
 Tunisia
-
 Turkey
-
 UAE
-
 Uganda
-
 Ukraine
-
 United Kingdom
-
United States
-
 Uruguay
-
 Uzbekistan
-
 Venezuela
-
 Vietnam
-
 Yemen
-
 Zambia
-
 Zimbabwe
- Forex
- Crypto












