

$79,148 resistance keeps Bitcoin in a tight range

Bitcoin (BTC) is trading at $77,994, up 0.82% for the day and currently sits below its key short- and medium-term moving averages, while remaining above its long-term average.
 76200
81196.01
Highlights
- U.S. spot Bitcoin ETFs recorded net outflows of $643.3 million on October 30, 2026, the largest daily withdrawal of the month.
- Binance replenished approximately 90% of assets lost in a $6.3 billion security breach and pledged to cover remaining customer losses.
- BTC/USD faces dominant short-term selling pressure with a 75% probability of drifting lower within the $75,469 to $80,518 range over the next 2 to 3 days.
Market steadies as Binance breach and ETF outflows drive volatility
U.S. spot Bitcoin ETFs saw substantial net outflows totaling $643.3 million on October 30, 2026, marking the largest daily withdrawal of the month as reported by Investing.com. The withdrawals came in the wake of a $6.3 billion security breach at Binance, which contributed to heightened market volatility. Binance responded by replenishing approximately 90% of the stolen assets and committed to absorb any remaining customer losses, helping to stabilize sentiment following the incident.
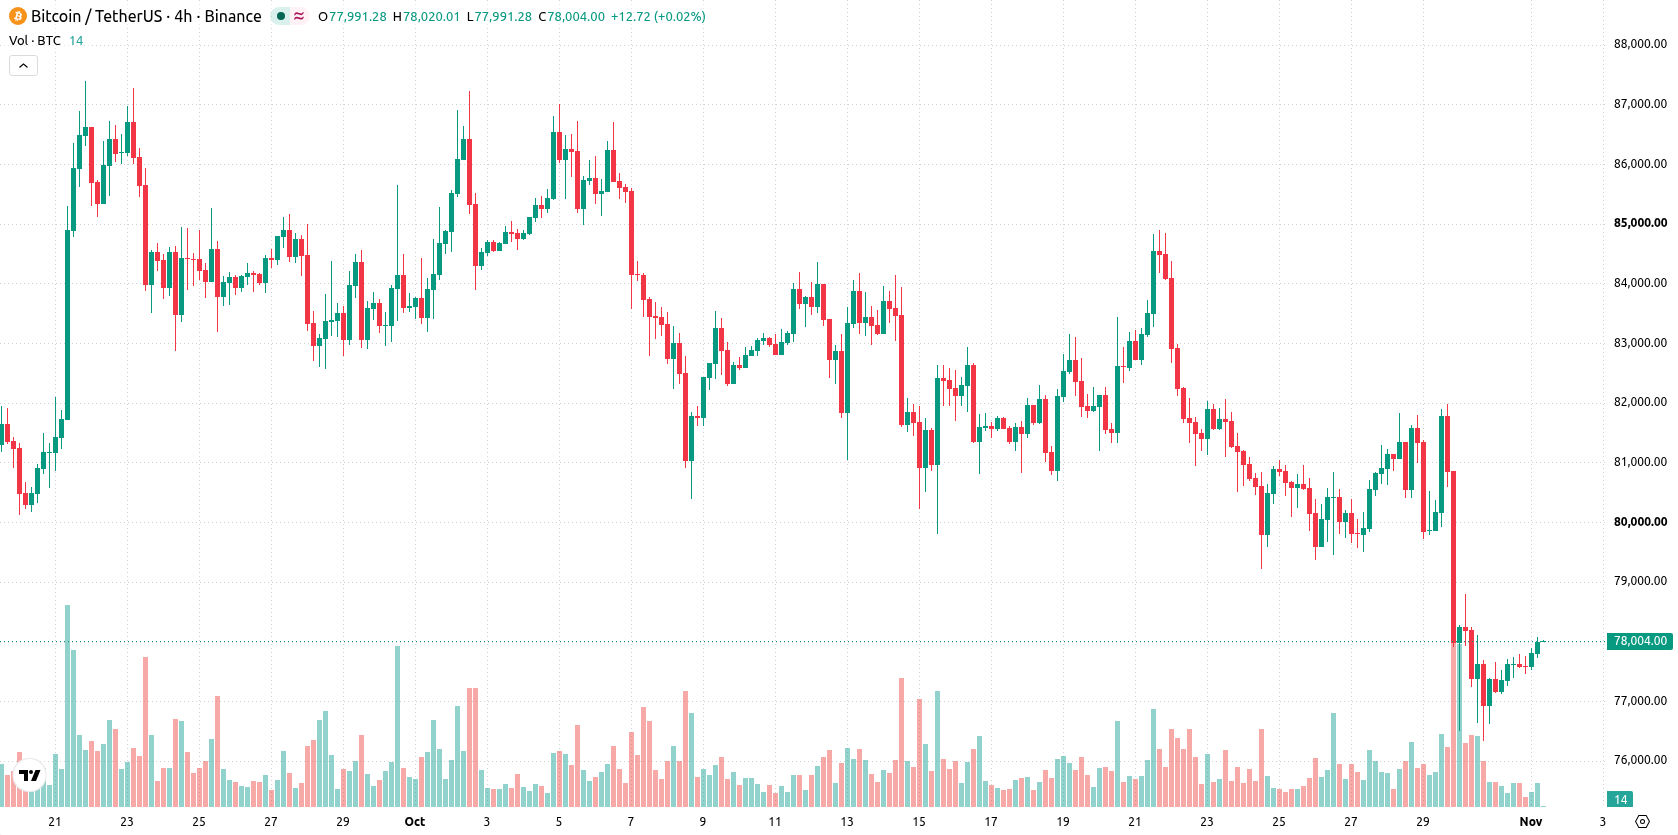
Seller momentum dominates as technical resistance and divergences persist
BTC/USD is trading below the MA-20 of $78,510 and the MA-50 of $79,731, with support remaining at the MA-200 of $73,179. The Ichimoku Kijun sits at $79,148 as an immediate resistance level. From an indicator perspective, the MACD is at Strong Sell and ADX also signals a Sell, while RSI at 40.06 and Bull/Bear Power both indicate seller dominance. Stochastic RSI is in Overbought territory and CCI is Neutral, showing mixed oscillator signals with Awesome Oscillator at Neutral, reflecting ongoing divergence between momentum and price.
Bearish bias set as odds of upside breakout remain low
BTC/USD is expected to remain within a typical volatility band of $75,469 to $80,518 over the next 2 to 3 trading days. The probability of a move higher is relatively low at 25%, suggesting that downward movement is more likely, though a sideways scenario remains the baseline. A break above $79,148 could open the way for a sustained bullish scenario, while a close below $75,469 may trigger additional selling.
Earlier, analysts noted that Bitcoin was exhibiting range-bound trading behavior amid persistent volatility and caution driven by major exchange-related security concerns. In light of recent ETF outflows and continued technical weakness, traders should closely monitor the $75,469 support as a key level that may determine the next directional move.











-
 Afghanistan
-
 Albania
-
 Algeria
-
 Angola
-
 Argentina
-
 Armenia
-
 Australia
-
 Austria
-
 Azerbaijan
-
 Bahamas
-
 Bahrain
-
 Bangladesh
-
 Belarus
-
 Belgium
-
 Bolivia
-
 Botswana
-
 Brazil
-
 Brunei
-
 Bulgaria
-
 Cambodia
-
 Cameroon
-
 Canada
-
 Chile
-
 China
-
 Colombia
-
 Congo
-
 Costa Rica
-
 Cote d'Ivoire
-
 Croatia
-
 Cuba
-
 Cyprus
-
 Czechia
-
 DR Congo
-
 Denmark
-
 Dominican Republic
-
 Ecuador
-
 Egypt
-
 El Salvador
-
 Estonia
-
 Eswatini
-
 Ethiopia
-
 Finland
-
 France
-
 Georgia
-
 Germany
-
 Ghana
-
 Greece
-
 Haiti
-
 Hong Kong
-
 Hungary
-
 India
-
 Indonesia
-
 Iran, Islamic republic
-
 Iraq
-
 Ireland
-
 Israel
-
 Italy
-
 Jamaica
-
 Japan
-
 Jordan
-
 Kazakhstan
-
 Kenya
-
 Korea
-
 Kuwait
-
 Kyrgyzstan
-
 Laos
-
 Latvia
-
 Lebanon
-
 Lesotho
-
 Libya
-
 Lithuania
-
 Luxembourg
-
 Madagascar
-
 Malaysia
-
 Malta
-
 Mauritius
-
 Mexico
-
 Moldova
-
 Mongolia
-
 Montenegro
-
 Morocco
-
 Mozambique
-
 Myanmar
-
 Namibia
-
 Nepal
-
 Netherlands
-
 New Zealand
-
 Nigeria
-
 North Macedonia
-
 Norway
-
 Oman
-
 Pakistan
-
 Palestine
-
 Panama
-
 Papua New Guinea
-
 Paraguay
-
 Peru
-
 Philippines
-
 Poland
-
 Portugal
-
 Puerto Rico
-
 Qatar
-
 Reunion
-
 Romania
-
 Rwanda
-
 Saudi Arabia
-
 Serbia
-
 Singapore
-
 Slovakia
-
 Slovenia
-
 Somalia
-
 South Africa
-
 Spain
-
 Sri Lanka
-
 Sweden
-
 Switzerland
-
 Syria
-
 Taiwan
-
 Tajikistan
-
 Tanzania
-
 Thailand
-
 Trinidad and Tobago
-
 Tunisia
-
 Turkey
-
 UAE
-
 Uganda
-
 Ukraine
-
 United Kingdom
-
United States
-
 Uruguay
-
 Uzbekistan
-
 Venezuela
-
 Vietnam
-
 Yemen
-
 Zambia
-
 Zimbabwe
- Forex
- Crypto












