


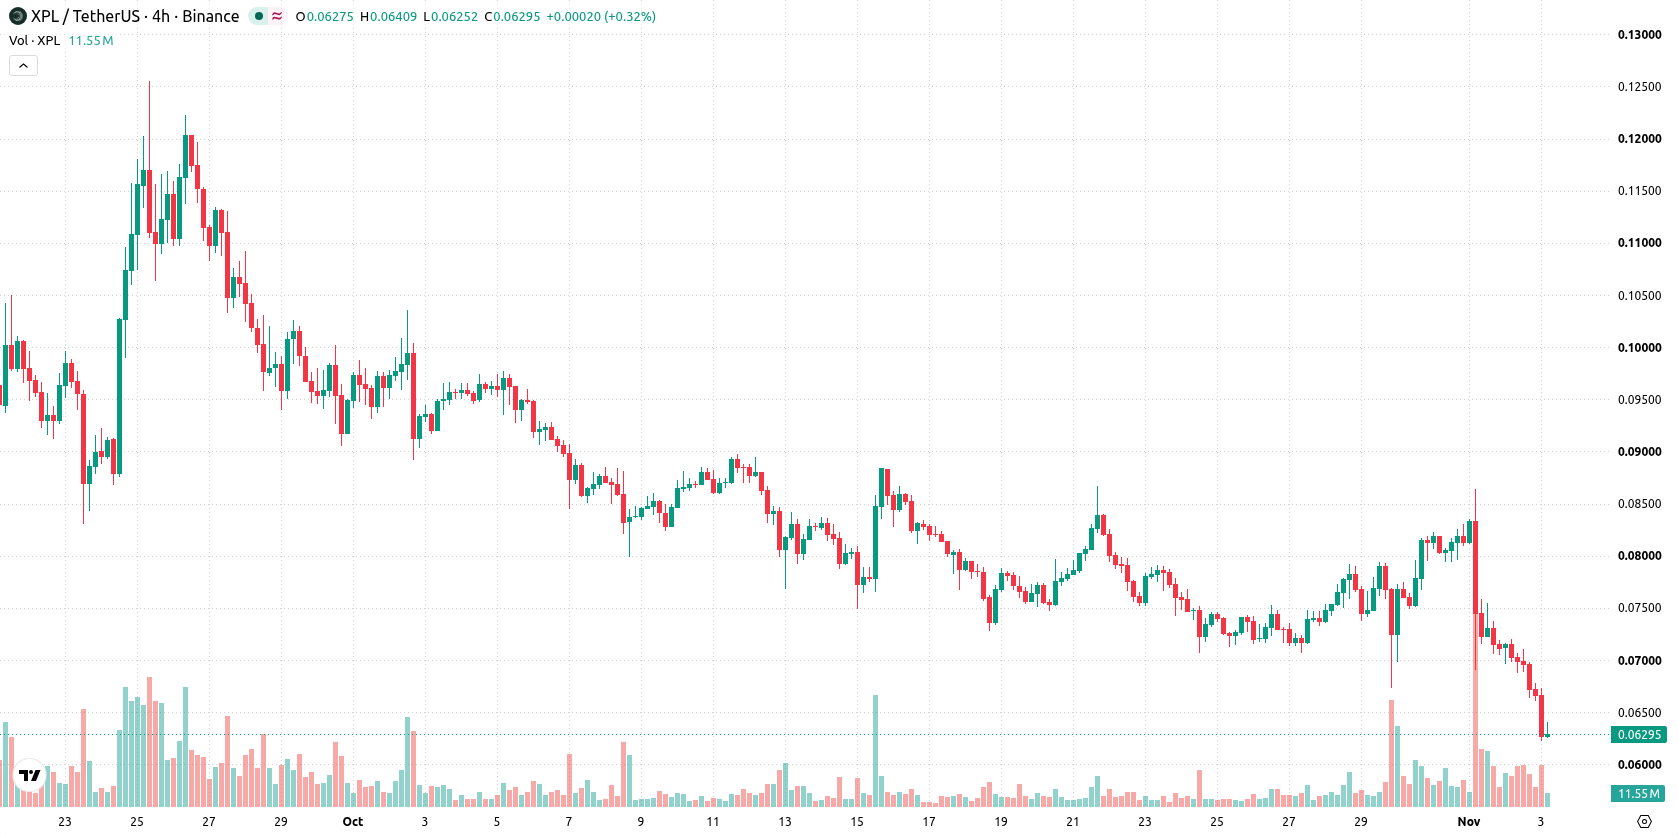
Plasma (XPL) dropped 11.43% on November 2, 2026, after reports highlighted liquidations of leveraged positions and a $17.3 million token release fueling sell pressure. The move is reinforced by XPL trading below its 20-, 50-, and 200-day moving averages, indicating clear technical weakness.
 0.0447
0.0550
Highlights
- Plasma experienced selling pressure linked to leveraged position liquidations and a reported token release valued at $17.3 million.
- Trading volume for Plasma surpassed its 30-day reference, with no confirmed impact from regulatory, macro, or technical events.
- XPL/USD trades below key moving averages and momentum signals remain bearish, with a forecast range of $0.0529 to $0.075 over the next 5 days.
Elevated trading volume highlights uncertainty amid liquidation-driven sales
On November 2, 2026, Plasma saw selling pressure attributed to liquidations of leveraged positions and a reported token release valued at $17.3 million. Reports noted that daily trading volume exceeded its 30-day reference. There was insufficient data to confirm the direct impact or any link to regulatory action, technical issues, macroeconomic, or protocol-specific events.
Persistent bearish momentum as support tested and indicators oversold
XPL/USD remains under pressure, with the price below the 20-day moving average at $0.0769, the 50-day at $0.0865, and the 200-day at $0.0884. This alignment indicates sustained seller dominance in the short, medium, and long term, further supported by the bearish setup between the 50- and 200-day averages. The nearest resistance is at $0.0661, while support sits at $0.0626. Momentum indicators paint a bearish picture: the Relative Strength Index (RSI) reads 36.5041 and forecasts a Sell, MACD is negative at -0.0046, and the Average Directional Index (ADX) stands at 17.6432, suggesting a lack of strong trend conviction. Both Stochastic RSI and Commodity Channel Index (CCI) indicate oversold conditions, which may flag potential short-term exhaustion for sellers. Bull/Bear Power (BBP) at -0.0035 confirms sellers currently dominate intraday moves. The price has fallen to $0.063, down 11.43% for the session, after opening with a downside gap near 6.33%. Trading is near the session low, and intraday volatility stands at 7.51%. Momentum and oscillator signals largely align to suggest persistent bearish pressure after the gap down.
Earlier, analysts noted that Plasma was exhibiting persistent downside risk and sustained technical weakness amid elevated volatility and liquidation-driven selloffs. The current developments reinforce this bearish bias, with traders advised to closely monitor the $0.0626 support level as a break below it could accelerate losses toward the lower end of the projected volatility range.






Latest Plasma News




-
 Afghanistan
-
 Albania
-
 Algeria
-
 Angola
-
 Argentina
-
 Armenia
-
 Australia
-
 Austria
-
 Azerbaijan
-
 Bahamas
-
 Bahrain
-
 Bangladesh
-
 Belarus
-
 Belgium
-
 Bolivia
-
 Botswana
-
 Brazil
-
 Brunei
-
 Bulgaria
-
 Cambodia
-
 Cameroon
-
 Canada
-
 Chile
-
 China
-
 Colombia
-
 Congo
-
 Costa Rica
-
 Cote d'Ivoire
-
 Croatia
-
 Cuba
-
 Cyprus
-
 Czechia
-
 DR Congo
-
 Denmark
-
 Dominican Republic
-
 Ecuador
-
 Egypt
-
 El Salvador
-
 Estonia
-
 Eswatini
-
 Ethiopia
-
 Finland
-
 France
-
 Georgia
-
 Germany
-
 Ghana
-
 Greece
-
 Haiti
-
 Hong Kong
-
 Hungary
-
 India
-
 Indonesia
-
 Iran, Islamic republic
-
 Iraq
-
 Ireland
-
 Israel
-
 Italy
-
 Jamaica
-
 Japan
-
 Jordan
-
 Kazakhstan
-
 Kenya
-
 Korea
-
 Kuwait
-
 Kyrgyzstan
-
 Laos
-
 Latvia
-
 Lebanon
-
 Lesotho
-
 Libya
-
 Lithuania
-
 Luxembourg
-
 Madagascar
-
 Malaysia
-
 Malta
-
 Mauritius
-
 Mexico
-
 Moldova
-
 Mongolia
-
 Montenegro
-
 Morocco
-
 Mozambique
-
 Myanmar
-
 Namibia
-
 Nepal
-
 Netherlands
-
 New Zealand
-
 Nigeria
-
 North Macedonia
-
 Norway
-
 Oman
-
 Pakistan
-
 Palestine
-
 Panama
-
 Papua New Guinea
-
 Paraguay
-
 Peru
-
 Philippines
-
 Poland
-
 Portugal
-
 Puerto Rico
-
 Qatar
-
 Reunion
-
 Romania
-
 Rwanda
-
 Saudi Arabia
-
 Serbia
-
 Singapore
-
 Slovakia
-
 Slovenia
-
 Somalia
-
 South Africa
-
 Spain
-
 Sri Lanka
-
 Sweden
-
 Switzerland
-
 Syria
-
 Taiwan
-
 Tajikistan
-
 Tanzania
-
 Thailand
-
 Trinidad and Tobago
-
 Tunisia
-
 Turkey
-
 UAE
-
 Uganda
-
 Ukraine
-
 United Kingdom
-
United States
-
 Uruguay
-
 Uzbekistan
-
 Venezuela
-
 Vietnam
-
 Yemen
-
 Zambia
-
 Zimbabwe
- Forex
- Crypto












