

Solana technical analysis: Seller pressure intensifies with key support at $88.91

Solana (SOL) is trading at $92.11, marking a 2.3% decline on the day. The price sits below its key short-term moving averages but remains above its long-term average, signaling ongoing short-term selling pressure with longer-term support in place.
 93.41
103.85
Highlights
- US spot Solana ETFs registered $71.47 million in net outflows last week, the largest withdrawal since launch and indicating reduced institutional demand.
- Solana network activity remained strong with $3.9 billion in tokenized stock trading volume in October and Q3 2026 application revenue up 48%.
- SOL/USD faces sustained bearish momentum, trading below key short-term averages and expected to fluctuate between $89.21 and $95.01 in the next 2 to 3 days.
Record ETF outflows as institutional demand declines amid network growth
US spot Solana ETFs saw notable net outflows totaling $71.47 million last week, marking the largest capital withdrawal since launch and signaling a reduction in institutional demand, according to Cryptonews. This outflow coincided with wallet data reported by Lookonchain, which showed 1.49 million SOL worth $148.77 million deposited to exchanges in the 10 days prior to November 2, increasing available supply and contributing to selling pressure. Despite this, fundamentals reflected ongoing network activity, with tokenized stock trading volume reaching $3.9 billion in October and over 500,000 holders, as well as Q3 2026 application revenue up 48% and spot DEX volumes climbing to $197.2 billion. These operational milestones underscore Solana’s broader usage and utility, though price action has remained under broader selling pressure.
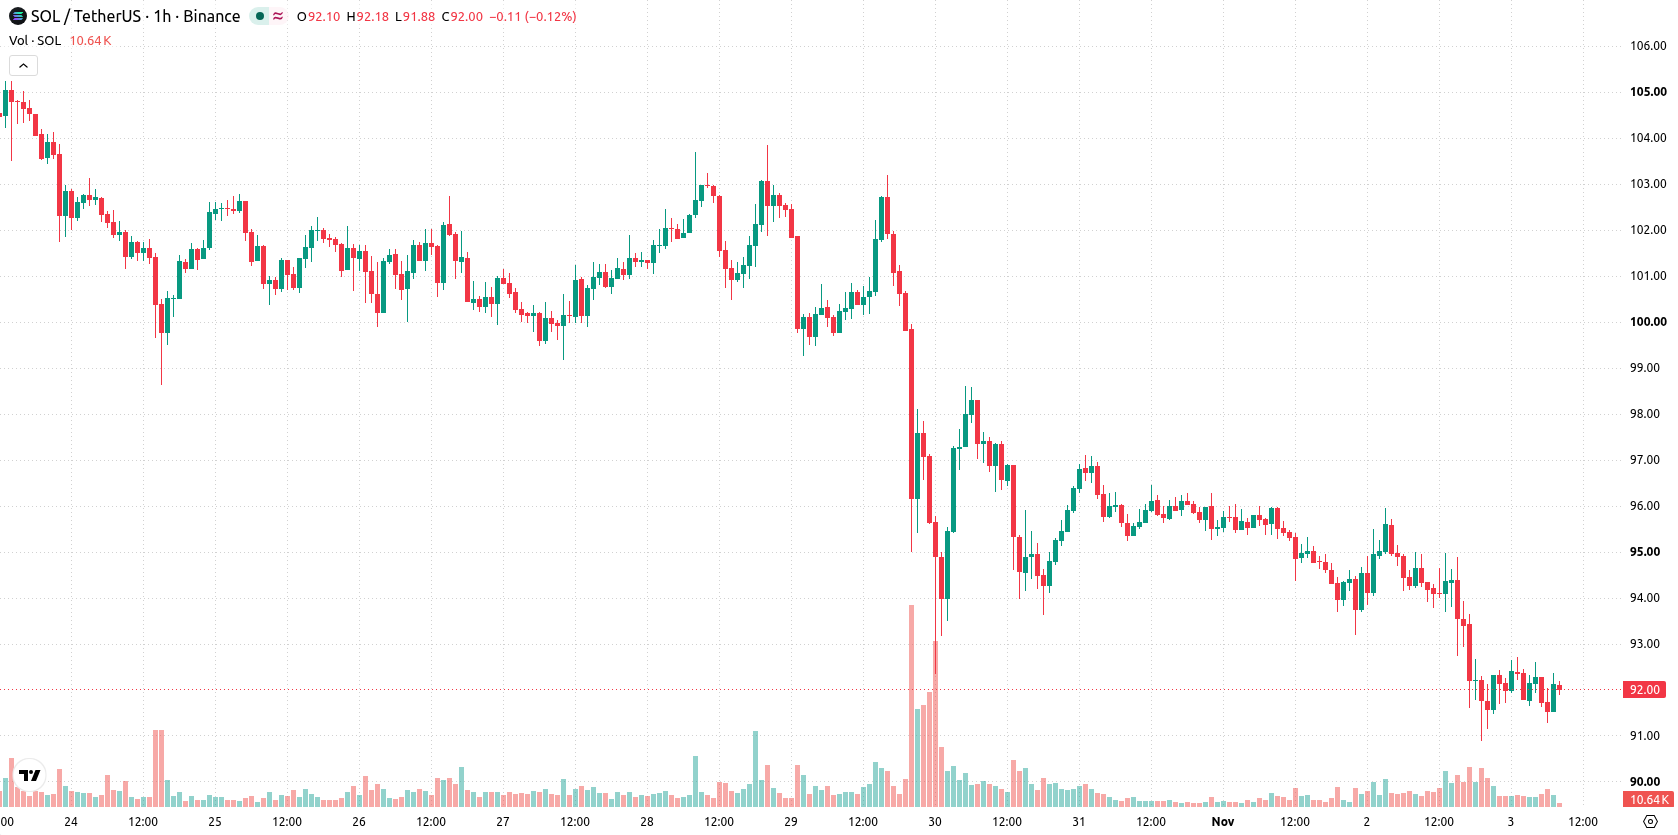
Bearish momentum dominates as price faces resistance and key support
On the technical front, SOL/USD is trading below the MA-20 at $92.61 and the MA-50 at $93.94 on the H1 chart, while remaining above the MA-200 at $88.91. The Ichimoku Kijun stands at $93.01, providing immediate resistance, with key support at the MA-200. Momentum indicators reflect sustained bearishness: RSI is at 33.39 (Sell), MACD maintains a Strong Sell signal, ADX and CCI both point to Sell, and Bull/Bear Power confirms a clear seller bias. Awesome Oscillator aligns with the downside, while Stochastic RSI registers as Neutral, collectively supporting a continuation of downward pressure in the short term.
Downside risk prevails as consolidation likely within defined range
Over the next 2 to 3 trading days, SOL/USD is projected to remain volatile within the $89.21 to $95.01 range. The likelihood of an upward move is considered very low, with downside risk elevated as sustained outflows and heavy selling pressure dominate. The baseline expectation is for price consolidation within this volatility band; a bullish reversal scenario would require a breakout above $93.01, while a move below $89.21 would open the door to deeper losses if current trends persist.
Previously it was reported that hackers who stole billions from Binance had begun laundering stolen Solana tokens, with investigators tracking substantial outflows and conversions across various blockchains. The current analysis adds a new dimension by highlighting mounting institutional outflows and technical downside signals for SOL, indicating that traders should closely watch for a break below the $89.21 support, which could catalyze further losses in the near term if sustained.






Latest Solana News





-
 Afghanistan
-
 Albania
-
 Algeria
-
 Angola
-
 Argentina
-
 Armenia
-
 Australia
-
 Austria
-
 Azerbaijan
-
 Bahamas
-
 Bahrain
-
 Bangladesh
-
 Belarus
-
 Belgium
-
 Bolivia
-
 Botswana
-
 Brazil
-
 Brunei
-
 Bulgaria
-
 Cambodia
-
 Cameroon
-
 Canada
-
 Chile
-
 China
-
 Colombia
-
 Congo
-
 Costa Rica
-
 Cote d'Ivoire
-
 Croatia
-
 Cuba
-
 Cyprus
-
 Czechia
-
 DR Congo
-
 Denmark
-
 Dominican Republic
-
 Ecuador
-
 Egypt
-
 El Salvador
-
 Estonia
-
 Eswatini
-
 Ethiopia
-
 Finland
-
 France
-
 Georgia
-
 Germany
-
 Ghana
-
 Greece
-
 Haiti
-
 Hong Kong
-
 Hungary
-
 India
-
 Indonesia
-
 Iran, Islamic republic
-
 Iraq
-
 Ireland
-
 Israel
-
 Italy
-
 Jamaica
-
 Japan
-
 Jordan
-
 Kazakhstan
-
 Kenya
-
 Korea
-
 Kuwait
-
 Kyrgyzstan
-
 Laos
-
 Latvia
-
 Lebanon
-
 Lesotho
-
 Libya
-
 Lithuania
-
 Luxembourg
-
 Madagascar
-
 Malaysia
-
 Malta
-
 Mauritius
-
 Mexico
-
 Moldova
-
 Mongolia
-
 Montenegro
-
 Morocco
-
 Mozambique
-
 Myanmar
-
 Namibia
-
 Nepal
-
 Netherlands
-
 New Zealand
-
 Nigeria
-
 North Macedonia
-
 Norway
-
 Oman
-
 Pakistan
-
 Palestine
-
 Panama
-
 Papua New Guinea
-
 Paraguay
-
 Peru
-
 Philippines
-
 Poland
-
 Portugal
-
 Puerto Rico
-
 Qatar
-
 Reunion
-
 Romania
-
 Rwanda
-
 Saudi Arabia
-
 Serbia
-
 Singapore
-
 Slovakia
-
 Slovenia
-
 Somalia
-
 South Africa
-
 Spain
-
 Sri Lanka
-
 Sweden
-
 Switzerland
-
 Syria
-
 Taiwan
-
 Tajikistan
-
 Tanzania
-
 Thailand
-
 Trinidad and Tobago
-
 Tunisia
-
 Turkey
-
 UAE
-
 Uganda
-
 Ukraine
-
 United Kingdom
-
United States
-
 Uruguay
-
 Uzbekistan
-
 Venezuela
-
 Vietnam
-
 Yemen
-
 Zambia
-
 Zimbabwe
- Forex
- Crypto












