

Bitcoin technical analysis: Upward price move approaches $79,017 resistance

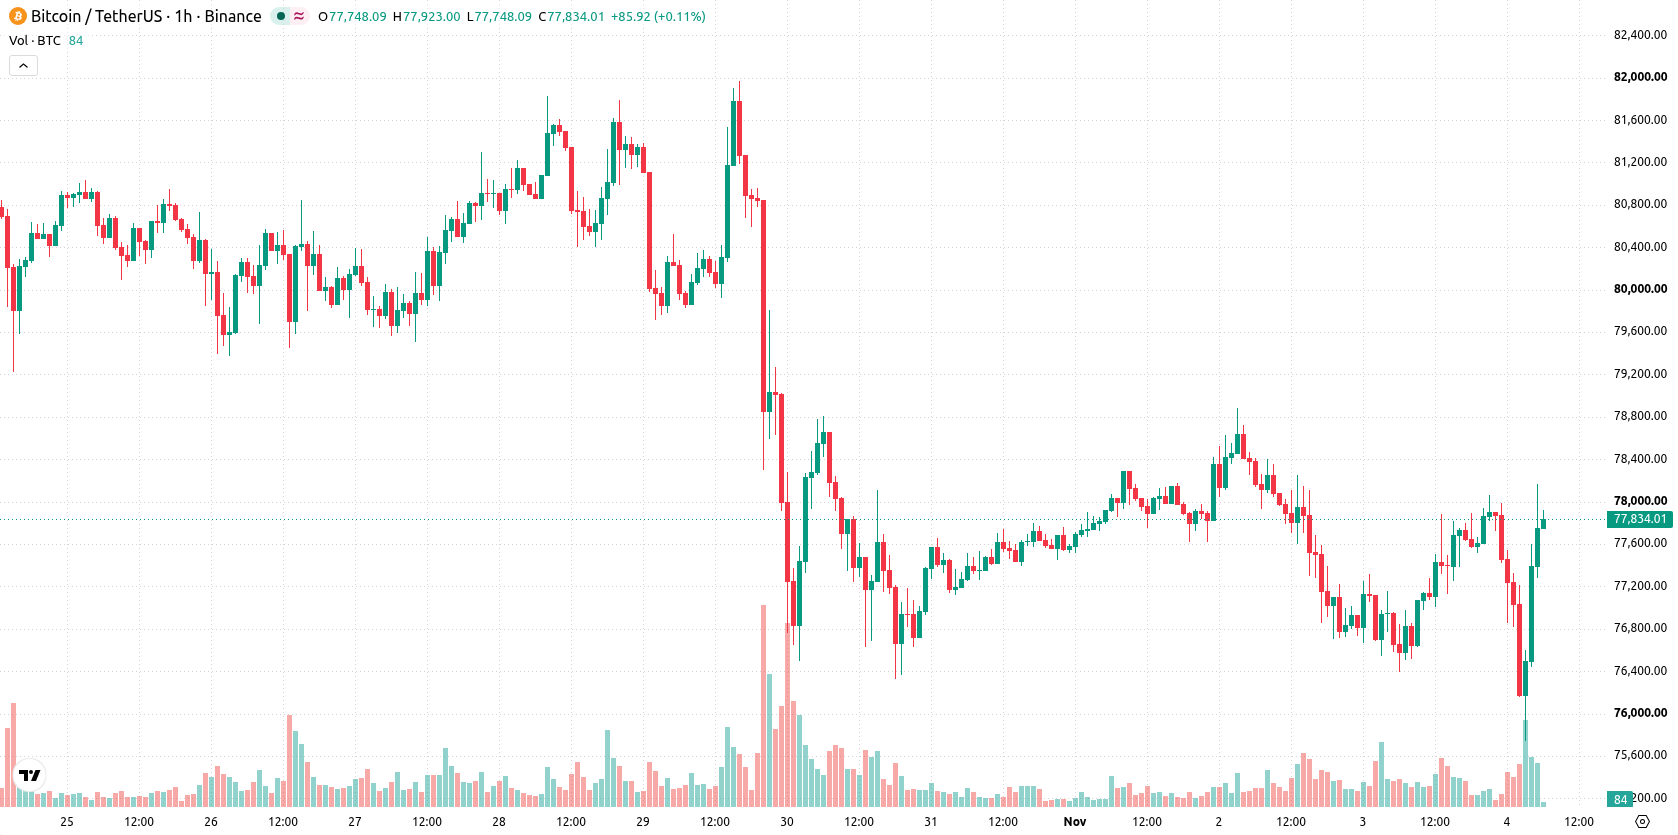
Bitcoin (BTC) is trading at $77,755, rising 1.5% over the last session and maintaining levels above its short-, medium-, and long-term moving averages. The price is positioned near today’s high amid low volatility.
 65447
74811.45
Highlights
- Strategy acquired 811 Bitcoin for $65.5 million, bringing total holdings to 849,327 BTC as institutional demand remains significant.
- US-listed spot Bitcoin ETFs recorded $398.6 million in net outflows on November 2, driven by large withdrawals from BlackRock and modest inflows at Fidelity.
- BTC/USD trades near daily highs between $74,940 and $79,017 with mixed momentum signals and low volatility over the next 2 to 3 sessions.
Institutional buying offsets ETF outflows as election uncertainty clouds sentiment
Strategy (NASDAQ: MSTR) acquired 811 Bitcoin for approximately $65.5 million on November 2, increasing its total holdings to 849,327 BTC. This significant institutional purchase highlights ongoing corporate demand for Bitcoin and may help offset short-term selling interest. At the same time, data from Farside Investors showed net outflows of $398.6 million from US-listed spot Bitcoin ETFs on the same day, driven by sizable withdrawals from BlackRock's iShares Bitcoin Trust and only modest inflows to Fidelity's FBTC. According to Cryptonews, broader investor withdrawals from Bitcoin funds and persistent uncertainty surrounding US midterm election outcomes have further contributed to caution across the market.
Mixed momentum signals as price outpaces key daily supports
BTC is trading above its MA-20 and MA-50 on the hourly chart, with price also holding well above the MA-200 on the daily timeframe. The Ichimoku Kijun on the daily sits at $76,899 and serves as immediate support. Daily momentum indicators are mixed: both MACD and ADX are printing sell signals, while the RSI, Stochastic RSI, and CCI show neutral readings with no clear momentum bias. Bull/Bear Power is in negative territory, suggesting that sellers currently outpace buyers on an intraday basis.
Sideways bias dominates as direction hinges on support-resistance break
Over the next 2–3 sessions, BTC/USD is expected to fluctuate within the $74,940 – $79,017 range, defining a volatility band relative to current levels. The baseline scenario sees price moving sideways within this corridor, with a 50% probability assigned to both upward and downward moves. A bullish scenario may develop if the price breaks above resistance, while a move below immediate support at the Ichimoku Kijun could signal a bearish turn.
Earlier, analysts noted that Bitcoin remained vulnerable following a sharp pullback and continued institutional outflows from spot ETFs, despite signs of recovering liquidity on major exchanges. In light of the recent major corporate accumulation and ongoing mixed fund flows, traders should closely monitor the established $74,940–$79,017 range as the primary zone for potential breakout or breakdown in the coming sessions.











-
 Afghanistan
-
 Albania
-
 Algeria
-
 Angola
-
 Argentina
-
 Armenia
-
 Australia
-
 Austria
-
 Azerbaijan
-
 Bahamas
-
 Bahrain
-
 Bangladesh
-
 Belarus
-
 Belgium
-
 Bolivia
-
 Botswana
-
 Brazil
-
 Brunei
-
 Bulgaria
-
 Cambodia
-
 Cameroon
-
 Canada
-
 Chile
-
 China
-
 Colombia
-
 Congo
-
 Costa Rica
-
 Cote d'Ivoire
-
 Croatia
-
 Cuba
-
 Cyprus
-
 Czechia
-
 DR Congo
-
 Denmark
-
 Dominican Republic
-
 Ecuador
-
 Egypt
-
 El Salvador
-
 Estonia
-
 Eswatini
-
 Ethiopia
-
 Finland
-
 France
-
 Georgia
-
 Germany
-
 Ghana
-
 Greece
-
 Haiti
-
 Hong Kong
-
 Hungary
-
 India
-
 Indonesia
-
 Iran, Islamic republic
-
 Iraq
-
 Ireland
-
 Israel
-
 Italy
-
 Jamaica
-
 Japan
-
 Jordan
-
 Kazakhstan
-
 Kenya
-
 Korea
-
 Kuwait
-
 Kyrgyzstan
-
 Laos
-
 Latvia
-
 Lebanon
-
 Lesotho
-
 Libya
-
 Lithuania
-
 Luxembourg
-
 Madagascar
-
 Malaysia
-
 Malta
-
 Mauritius
-
 Mexico
-
 Moldova
-
 Mongolia
-
 Montenegro
-
 Morocco
-
 Mozambique
-
 Myanmar
-
 Namibia
-
 Nepal
-
 Netherlands
-
 New Zealand
-
 Nigeria
-
 North Macedonia
-
 Norway
-
 Oman
-
 Pakistan
-
 Palestine
-
 Panama
-
 Papua New Guinea
-
 Paraguay
-
 Peru
-
 Philippines
-
 Poland
-
 Portugal
-
 Puerto Rico
-
 Qatar
-
 Reunion
-
 Romania
-
 Rwanda
-
 Saudi Arabia
-
 Serbia
-
 Singapore
-
 Slovakia
-
 Slovenia
-
 Somalia
-
 South Africa
-
 Spain
-
 Sri Lanka
-
 Sweden
-
 Switzerland
-
 Syria
-
 Taiwan
-
 Tajikistan
-
 Tanzania
-
 Thailand
-
 Trinidad and Tobago
-
 Tunisia
-
 Turkey
-
 UAE
-
 Uganda
-
 Ukraine
-
 United Kingdom
-
United States
-
 Uruguay
-
 Uzbekistan
-
 Venezuela
-
 Vietnam
-
 Yemen
-
 Zambia
-
 Zimbabwe
- Forex
- Crypto












