

What's behind Bitcoin's latest 5.2% price pullback?

Bitcoin (BTC/USD) slumped 5.2% after US spot Bitcoin ETFs recorded $74.6 million in inflows, with mining-related financial disclosures drawing increased scrutiny. The selloff is supported by the pair remaining below its 20-day and 50-day moving averages, reinforcing near-term technical resistance.
 75599.22
81196.01
Highlights
- Spot Bitcoin ETFs in the US saw $74.6 million in new inflows, with outflows continuing from BlackRock's IBIT fund.
- Non-cash gains from Bitcoin price appreciation significantly affected mining companies’ financials, and daily US Bitcoin production is around 450 BTC.
- BTC/USD shows short- and medium-term seller pressure below key averages, with a high probability of downside toward the $73,214 to $80,278 range.
Institutional sentiment softens amid ETF inflows and regulatory concerns
Spot Bitcoin ETFs in the US recorded $74.6 million in inflows in a recent session, a move accompanied by continued outflows from BlackRock's IBIT fund. Mining companies such as American Bitcoin Corp reported that non-cash gains from BTC price appreciation significantly impacted their financial results. Daily Bitcoin production was reported at approximately 450 BTC, and ongoing US regulatory uncertainty and legislative delays have influenced institutional sentiment, though price action has remained under broader selling pressure.
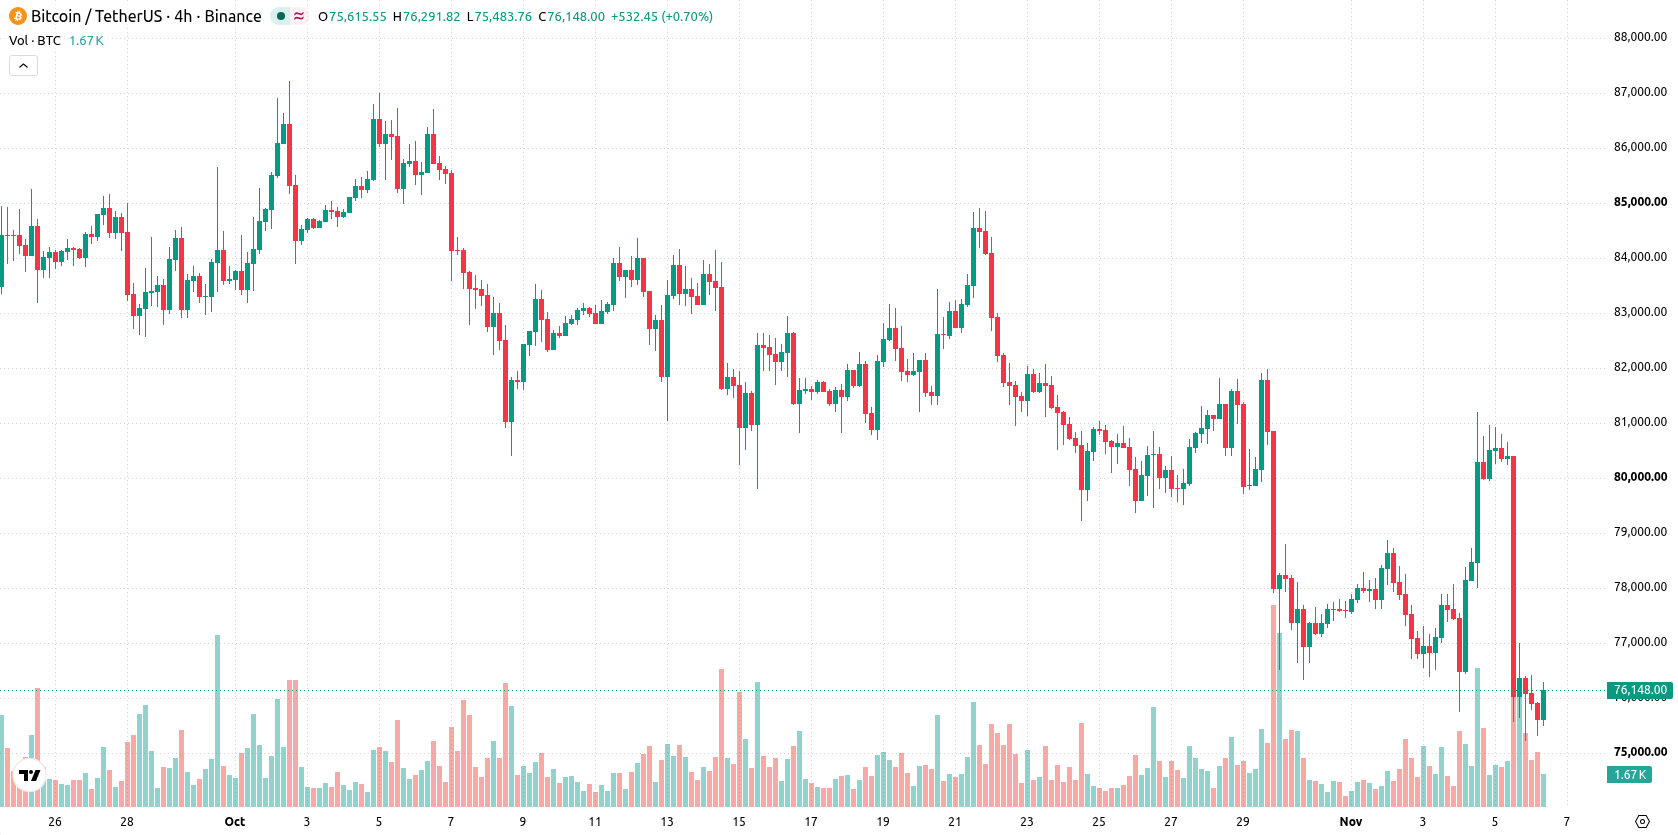
Short-term seller pressure persists with resilience above long-term support
BTC/USD is currently trading below the 20-day and 50-day moving averages ($80,052 and $82,064), but remains above the 200-day moving average ($73,243), suggesting short- and medium-term seller pressure with longer-term trend support still intact. The price is approaching the near-term ceiling at $76,416 and is supported by the near-term floor at $75,304, with the Ichimoku Kijun ($80,233) acting as a notable overhead resistance in the prevailing bullish long-term structure. Momentum is bearish, as both the MACD and Average Directional Index (ADX) indicate ongoing selling strength. The Relative Strength Index (RSI), Stochastic RSI, and Commodity Channel Index (CCI) are all neutral, so none of these oscillators is signaling an overbought or oversold condition. Bull/Bear Power (BBP) remains positive, indicating buyers still hold relative dominance intraday despite today's negative tone. The pair opened with a downside gap of roughly 5.35% and currently trades near the upper end of today’s range, after falling $4,180.02 (slipping 5.2%) to $76,208. Intraday volatility stands at 1.48%, reflecting resilient activity after initial selling pressure and some stabilization near session highs.
Earlier, analysts noted that Bitcoin was under sustained selling pressure, with downside risks dominating amid persistent technical weakness. The current article reinforces this outlook, and traders should monitor the $75,304 support level closely as a breach could signal further downside in the days ahead.






Latest Bitcoin News



-
 Afghanistan
-
 Albania
-
 Algeria
-
 Angola
-
 Argentina
-
 Armenia
-
 Australia
-
 Austria
-
 Azerbaijan
-
 Bahamas
-
 Bahrain
-
 Bangladesh
-
 Belarus
-
 Belgium
-
 Bolivia
-
 Botswana
-
 Brazil
-
 Brunei
-
 Bulgaria
-
 Cambodia
-
 Cameroon
-
 Canada
-
 Chile
-
 China
-
 Colombia
-
 Congo
-
 Costa Rica
-
 Cote d'Ivoire
-
 Croatia
-
 Cuba
-
 Cyprus
-
 Czechia
-
 DR Congo
-
 Denmark
-
 Dominican Republic
-
 Ecuador
-
 Egypt
-
 El Salvador
-
 Estonia
-
 Eswatini
-
 Ethiopia
-
 Finland
-
 France
-
 Georgia
-
 Germany
-
 Ghana
-
 Greece
-
 Haiti
-
 Hong Kong
-
 Hungary
-
 India
-
 Indonesia
-
 Iran, Islamic republic
-
 Iraq
-
 Ireland
-
 Israel
-
 Italy
-
 Jamaica
-
 Japan
-
 Jordan
-
 Kazakhstan
-
 Kenya
-
 Korea
-
 Kuwait
-
 Kyrgyzstan
-
 Laos
-
 Latvia
-
 Lebanon
-
 Lesotho
-
 Libya
-
 Lithuania
-
 Luxembourg
-
 Madagascar
-
 Malaysia
-
 Malta
-
 Mauritius
-
 Mexico
-
 Moldova
-
 Mongolia
-
 Montenegro
-
 Morocco
-
 Mozambique
-
 Myanmar
-
 Namibia
-
 Nepal
-
 Netherlands
-
 New Zealand
-
 Nigeria
-
 North Macedonia
-
 Norway
-
 Oman
-
 Pakistan
-
 Palestine
-
 Panama
-
 Papua New Guinea
-
 Paraguay
-
 Peru
-
 Philippines
-
 Poland
-
 Portugal
-
 Puerto Rico
-
 Qatar
-
 Reunion
-
 Romania
-
 Rwanda
-
 Saudi Arabia
-
 Serbia
-
 Singapore
-
 Slovakia
-
 Slovenia
-
 Somalia
-
 South Africa
-
 Spain
-
 Sri Lanka
-
 Sweden
-
 Switzerland
-
 Syria
-
 Taiwan
-
 Tajikistan
-
 Tanzania
-
 Thailand
-
 Trinidad and Tobago
-
 Tunisia
-
 Turkey
-
 UAE
-
 Uganda
-
 Ukraine
-
 United Kingdom
-
United States
-
 Uruguay
-
 Uzbekistan
-
 Venezuela
-
 Vietnam
-
 Yemen
-
 Zambia
-
 Zimbabwe
- Forex
- Crypto












