

What's behind Ethereum's latest 7.5% price pullback?

Ethereum (ETH) slid 7.48% today after a brief rebound in ETF inflows reversed consecutive withdrawal days, with the market instead reacting to renewed selling pressure. The decline is reinforced by the pair’s slip below its 20-day and 50-day moving averages, highlighting persistent short- and medium-term technical weakness.
 1732.52
1866.89
Highlights
- Spot Ethereum ETFs recorded $53 million in net inflows, ending a seven-day stretch of withdrawals totaling over $650 million.
- Bitmine holds nearly 5% of all ETH, mostly staked in validators, and the Glamsterdam network upgrade testnet faces delays.
- ETH/USD trades below key short- and medium-term moving averages, with a projected five-session range of $2,116 to $2,483 and strong downside probability.
Institutional inflows offset by upgrade delays and concentrated holdings
On November 4, 2026, spot Ethereum ETFs saw about $53 million in net inflows, ending a seven-day streak of withdrawals that had totaled over $650 million. Major ETF products from BlackRock and Fidelity led these inflows, indicating renewed institutional interest. Ethereum’s upcoming Glamsterdam network upgrade faced delays in its testnet activation, and Bitmine disclosed holdings of nearly 5% of all ETH, primarily staked in validators, though price action has remained under broader selling pressure.
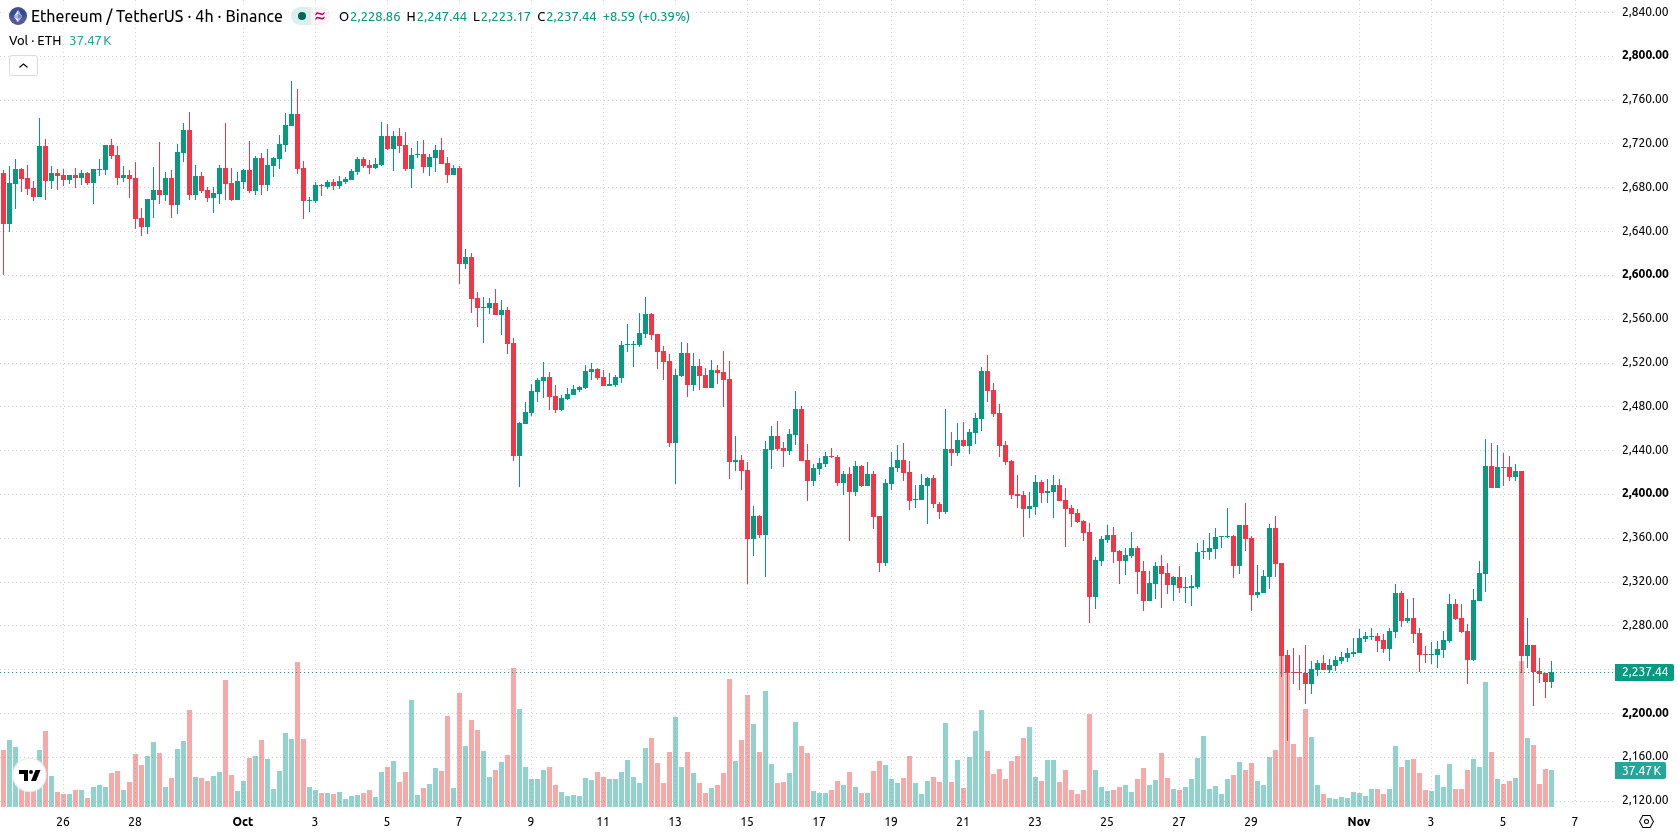
Bearish momentum persists as key boundaries and volatility define range
ETH/USD is now trading below both its 20-day and 50-day moving averages at $2,343 and $2,505, signaling short- and medium-term downward pressure. The pair remains above its 200-day moving average at $2,158, which keeps the long-term trend bullish. Immediate overhead resistance stands at the Ichimoku Kijun level of $2,376. Near-term technical boundaries place the ceiling at $2,250 and the floor at $2,213. MACD confirms strong bearish momentum, with ADX showing a moderately trending market. Oscillators like the Relative Strength Index, Stochastic RSI, and Commodity Channel Index remain neutral, indicating neither overbought nor oversold conditions. Bull/Bear Power is positive, reflecting persistent intraday buying as volatility spikes and buyers look to stabilize the pullback.
Earlier, analysts noted that persistent ETF outflows technical resistance and regulatory uncertainties were weighing on Ethereum’s price outlook. With new ETF inflows failing to ignite a rebound and technical pressure intensifying, traders should monitor $2,213 as the next critical support level amid elevated downside risks.











-
 Afghanistan
-
 Albania
-
 Algeria
-
 Angola
-
 Argentina
-
 Armenia
-
 Australia
-
 Austria
-
 Azerbaijan
-
 Bahamas
-
 Bahrain
-
 Bangladesh
-
 Belarus
-
 Belgium
-
 Bolivia
-
 Botswana
-
 Brazil
-
 Brunei
-
 Bulgaria
-
 Cambodia
-
 Cameroon
-
 Canada
-
 Chile
-
 China
-
 Colombia
-
 Congo
-
 Costa Rica
-
 Cote d'Ivoire
-
 Croatia
-
 Cuba
-
 Cyprus
-
 Czechia
-
 DR Congo
-
 Denmark
-
 Dominican Republic
-
 Ecuador
-
 Egypt
-
 El Salvador
-
 Estonia
-
 Eswatini
-
 Ethiopia
-
 Finland
-
 France
-
 Georgia
-
 Germany
-
 Ghana
-
 Greece
-
 Haiti
-
 Hong Kong
-
 Hungary
-
 India
-
 Indonesia
-
 Iran, Islamic republic
-
 Iraq
-
 Ireland
-
 Israel
-
 Italy
-
 Jamaica
-
 Japan
-
 Jordan
-
 Kazakhstan
-
 Kenya
-
 Korea
-
 Kuwait
-
 Kyrgyzstan
-
 Laos
-
 Latvia
-
 Lebanon
-
 Lesotho
-
 Libya
-
 Lithuania
-
 Luxembourg
-
 Madagascar
-
 Malaysia
-
 Malta
-
 Mauritius
-
 Mexico
-
 Moldova
-
 Mongolia
-
 Montenegro
-
 Morocco
-
 Mozambique
-
 Myanmar
-
 Namibia
-
 Nepal
-
 Netherlands
-
 New Zealand
-
 Nigeria
-
 North Macedonia
-
 Norway
-
 Oman
-
 Pakistan
-
 Palestine
-
 Panama
-
 Papua New Guinea
-
 Paraguay
-
 Peru
-
 Philippines
-
 Poland
-
 Portugal
-
 Puerto Rico
-
 Qatar
-
 Reunion
-
 Romania
-
 Rwanda
-
 Saudi Arabia
-
 Serbia
-
 Singapore
-
 Slovakia
-
 Slovenia
-
 Somalia
-
 South Africa
-
 Spain
-
 Sri Lanka
-
 Sweden
-
 Switzerland
-
 Syria
-
 Taiwan
-
 Tajikistan
-
 Tanzania
-
 Thailand
-
 Trinidad and Tobago
-
 Tunisia
-
 Turkey
-
 UAE
-
 Uganda
-
 Ukraine
-
 United Kingdom
-
United States
-
 Uruguay
-
 Uzbekistan
-
 Venezuela
-
 Vietnam
-
 Yemen
-
 Zambia
-
 Zimbabwe
- Forex
- Crypto












