

Tezos falls as downward price move follows sharp drop and high volatility

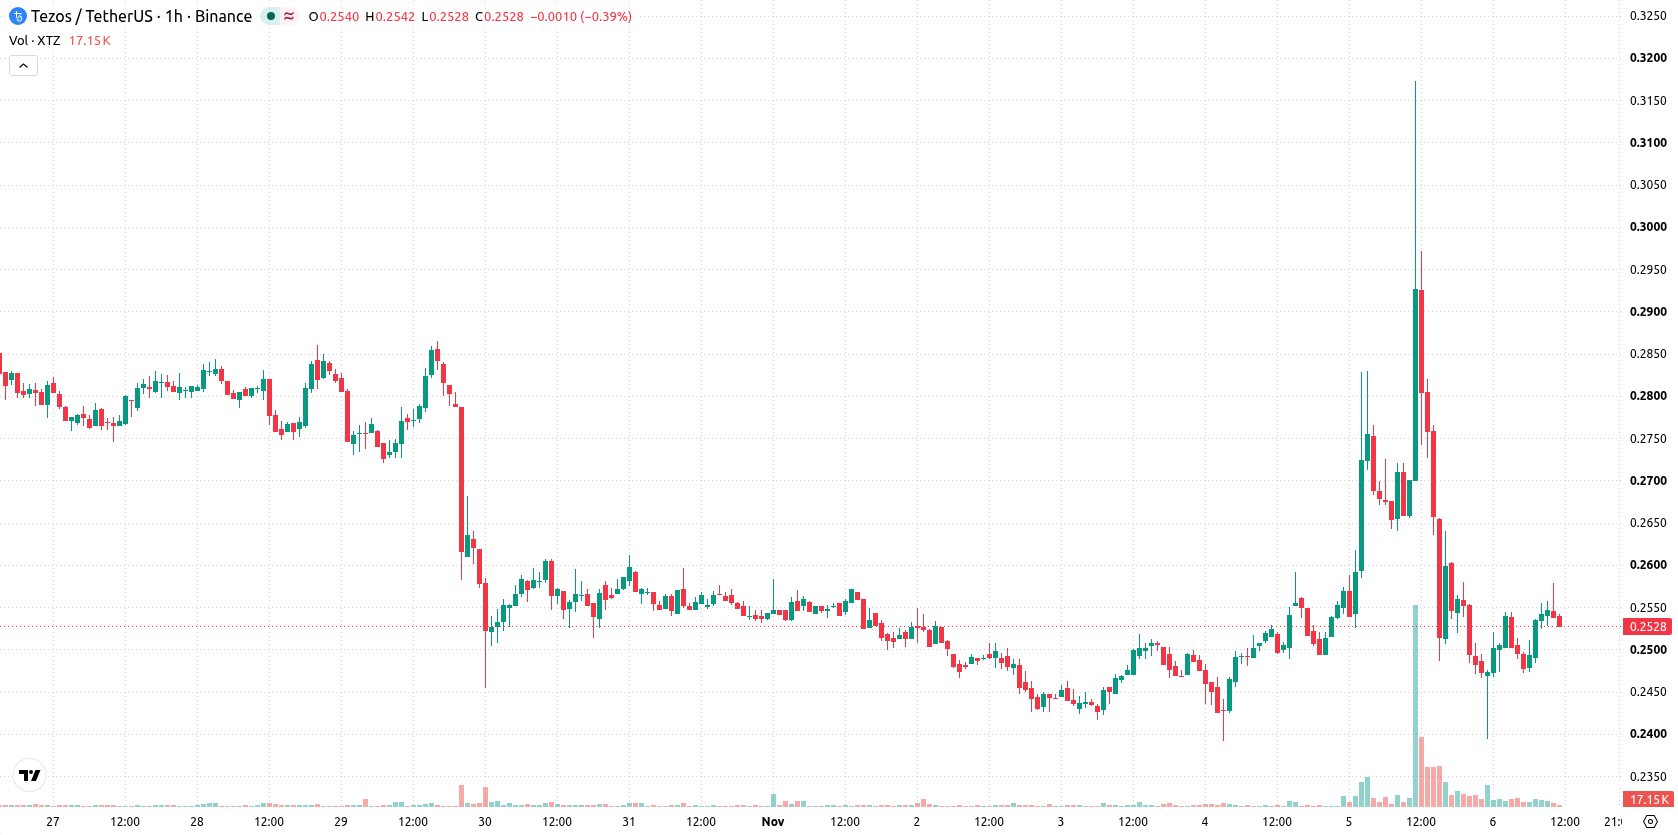
Tezos (XTZ) is trading at $0.2533 after declining by 7.59% over the last 24 hours. The price is currently above its key short-term moving average, but remains below those for the medium and long term.
 0.2685
0.31730000
Highlights
- XTZ/USD has rebounded intraday but remains pressured below medium- and long-term trend levels.
- Momentum signals are mixed with a strong sell bias on the MACD and overbought conditions in short-term oscillators.
- For the next 2 to 3 days, XTZ/USD is expected to range between $0.23581395 and $0.27078605 with no clear breakout direction.
Momentum divergence persists as resistance caps recovery attempt
XTZ/USD is trading above its MA-20, but remains below the MA-50 and well under the MA-200. The Ichimoku Kijun on the daily chart is at $0.27835 and acts as immediate resistance, while recent price action has stayed near the day's high after a sharp drop. MACD signals a strong sell bias, whereas ADX points to notable underlying buyer strength, suggesting momentum divergence. RSI and CCI remain neutral. Stoch RSI is in the overbought zone, indicating potential short-term overheating. Bull/Bear Power shows slight buyer dominance, and the Awesome Oscillator is neutral. The high daily range and volatility contradict the negative gap move and today's sharp decline.
Neutral outlook dominates as breakout triggers remain absent
In the next 2 to 3 trading days, the projected price range for XTZ/USD is $0.23581395 to $0.27078605. Both upward and downward moves are equally probable, with neither side showing a clear advantage for follow-through. The baseline scenario is a sideways trading range. A bullish outcome would require a breakout above the Ichimoku Kijun and the upper end of the forecast band, while a bearish move would arise if price falls below the projected support level.
Earlier, analysts noted that Tezos was exhibiting bullish technical trends but faced limited momentum and caution around key breakout levels. The current price decline shifts the focus toward potential volatility around the projected trading range, with breakouts above $0.27078605 or below $0.23581395 likely to determine the next directional move.











-
 Afghanistan
-
 Albania
-
 Algeria
-
 Angola
-
 Argentina
-
 Armenia
-
 Australia
-
 Austria
-
 Azerbaijan
-
 Bahamas
-
 Bahrain
-
 Bangladesh
-
 Belarus
-
 Belgium
-
 Bolivia
-
 Botswana
-
 Brazil
-
 Brunei
-
 Bulgaria
-
 Cambodia
-
 Cameroon
-
 Canada
-
 Chile
-
 China
-
 Colombia
-
 Congo
-
 Costa Rica
-
 Cote d'Ivoire
-
 Croatia
-
 Cuba
-
 Cyprus
-
 Czechia
-
 DR Congo
-
 Denmark
-
 Dominican Republic
-
 Ecuador
-
 Egypt
-
 El Salvador
-
 Estonia
-
 Eswatini
-
 Ethiopia
-
 Finland
-
 France
-
 Georgia
-
 Germany
-
 Ghana
-
 Greece
-
 Haiti
-
 Hong Kong
-
 Hungary
-
 India
-
 Indonesia
-
 Iran, Islamic republic
-
 Iraq
-
 Ireland
-
 Israel
-
 Italy
-
 Jamaica
-
 Japan
-
 Jordan
-
 Kazakhstan
-
 Kenya
-
 Korea
-
 Kuwait
-
 Kyrgyzstan
-
 Laos
-
 Latvia
-
 Lebanon
-
 Lesotho
-
 Libya
-
 Lithuania
-
 Luxembourg
-
 Madagascar
-
 Malaysia
-
 Malta
-
 Mauritius
-
 Mexico
-
 Moldova
-
 Mongolia
-
 Montenegro
-
 Morocco
-
 Mozambique
-
 Myanmar
-
 Namibia
-
 Nepal
-
 Netherlands
-
 New Zealand
-
 Nigeria
-
 North Macedonia
-
 Norway
-
 Oman
-
 Pakistan
-
 Palestine
-
 Panama
-
 Papua New Guinea
-
 Paraguay
-
 Peru
-
 Philippines
-
 Poland
-
 Portugal
-
 Puerto Rico
-
 Qatar
-
 Reunion
-
 Romania
-
 Rwanda
-
 Saudi Arabia
-
 Serbia
-
 Singapore
-
 Slovakia
-
 Slovenia
-
 Somalia
-
 South Africa
-
 Spain
-
 Sri Lanka
-
 Sweden
-
 Switzerland
-
 Syria
-
 Taiwan
-
 Tajikistan
-
 Tanzania
-
 Thailand
-
 Trinidad and Tobago
-
 Tunisia
-
 Turkey
-
 UAE
-
 Uganda
-
 Ukraine
-
 United Kingdom
-
United States
-
 Uruguay
-
 Uzbekistan
-
 Venezuela
-
 Vietnam
-
 Yemen
-
 Zambia
-
 Zimbabwe
- Forex
- Crypto












