

Bitcoin faces $1.28 billion ETF outflows and regulation shakeup: BTC remains under pressure

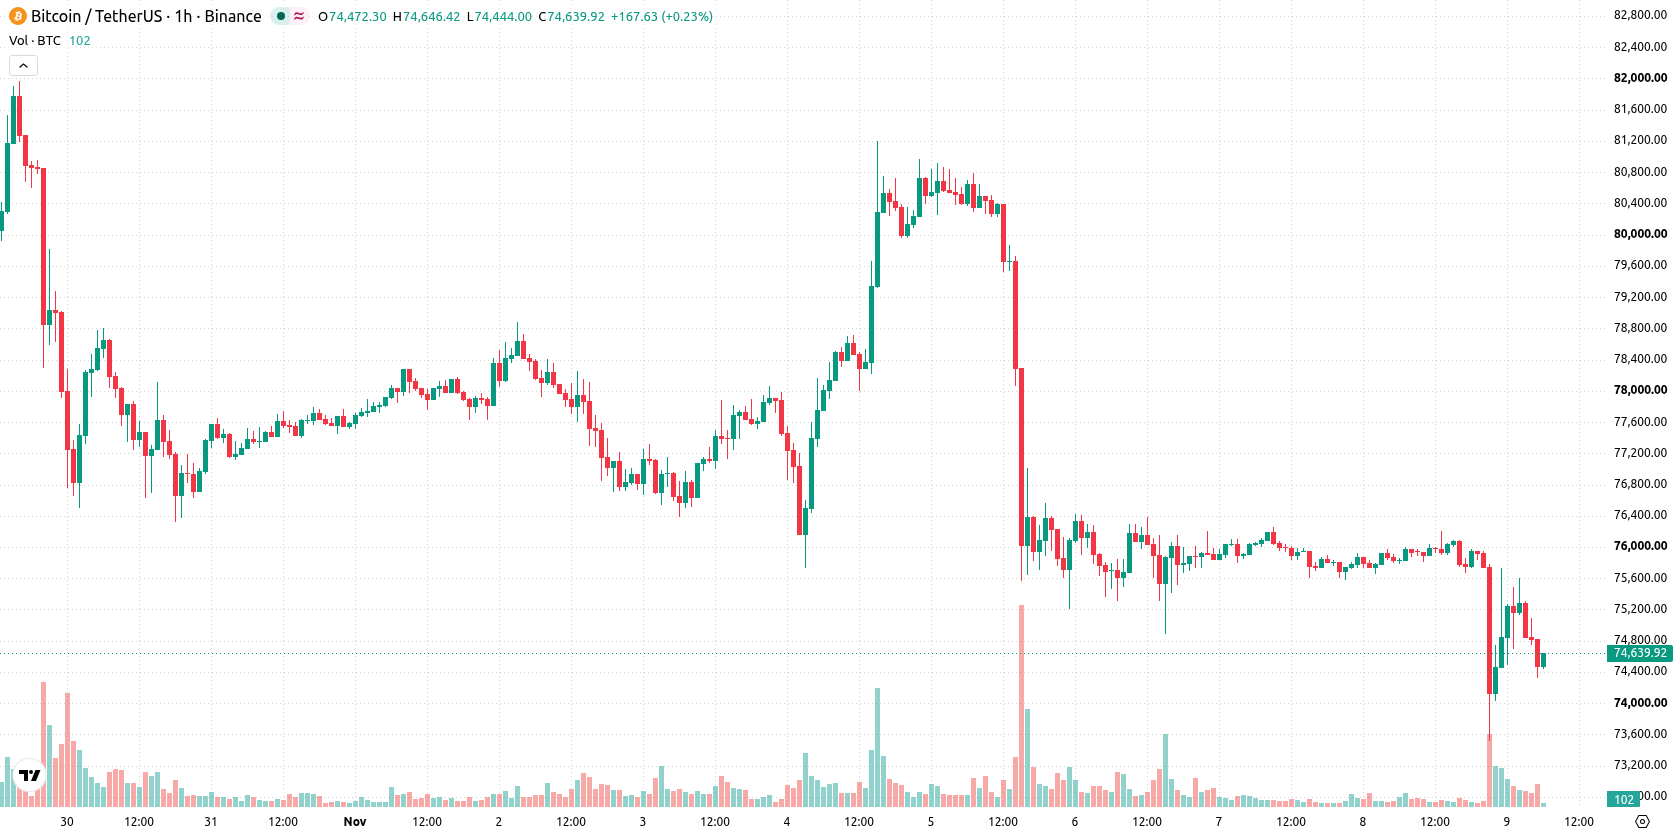
Bitcoin (BTC) is trading at $74,472, marking a daily decline of 1.77%. The asset remains below its short- and medium-term moving averages but continues to hold above its longer-term trend support.
 65595.77
75599.22
Highlights
- US spot Bitcoin ETFs saw $1.28 billion in net outflows from November 2 to November 6, 2026, indicating a pullback in institutional demand.
- Regulatory uncertainty following the Democratic sweep of Congress and Bitcoin trading below key corporate cost basis have pressured institutional holdings.
- BTC/USD trades below key short- and medium-term moving averages with momentum indicators bearish, projecting a likely range of $72,753 to $76,190 and a high probability of further downside.
Institutional outflows increase as regulatory risk and macro data loom
US spot Bitcoin ETFs recorded $1.28 billion in net outflows between November 2 and November 6, 2026, signaling a broad reduction in institutional demand for spot exposure, according to Cryptoticker. This was accompanied by regulatory uncertainty following the Democratic sweep of Congress, with additional market hesitation ahead of upcoming U.S. CPI and PPI reports. Furthermore, institutional holdings came under pressure as Bitcoin traded below Strategy’s disclosed average purchase price, with data from Cryptonews highlighting underwater positions on corporate books.
Selling momentum persists as key resistance limits rebound attempts
BTC/USD is trading below the MA-20 and MA-50 on the hourly chart, with the MA-200 still providing underlying support. The Ichimoku Kijun at $74,855 acts as immediate resistance and may cap near-term rebounds. MACD and ADX show ongoing selling momentum, while RSI, Stoch RSI, and CCI remain neutral, reflecting no clear overbought or oversold signals. Bull/Bear Power remains negative, and the Awesome Oscillator is neutral, indicating that although price momentum is downward, oscillators show a possible short-term exhaustion of sellers.
Further downside risk as price action expected within volatility band
Over the next two to three sessions, BTC/USD is projected to trade within a range of $72,753 to $76,190, representing a volatility band relative to current price levels. Downside scenarios dominate, with a break below $72,753 likely to trigger deeper losses. Conversely, a decisive move above $74,855 would be needed to reverse immediate bearish risks. The baseline expectation is that price action remains within this corridor as market participants absorb recent selling pressure.
Earlier, analysts noted that Bitcoin's price remained highly sensitive to shifting institutional flows and macro events, especially following significant ETF outflows and regulatory uncertainty. The prevailing scenario now is continued range-bound movement with downside risks, as the market digests renewed reductions in ETF demand and awaits signals from upcoming U.S. inflation data; traders should closely watch the $72,753 support for potential accelerated losses.










-
 Afghanistan
-
 Albania
-
 Algeria
-
 Angola
-
 Argentina
-
 Armenia
-
 Australia
-
 Austria
-
 Azerbaijan
-
 Bahamas
-
 Bahrain
-
 Bangladesh
-
 Belarus
-
 Belgium
-
 Bolivia
-
 Botswana
-
 Brazil
-
 Brunei
-
 Bulgaria
-
 Cambodia
-
 Cameroon
-
 Canada
-
 Chile
-
 China
-
 Colombia
-
 Congo
-
 Costa Rica
-
 Cote d'Ivoire
-
 Croatia
-
 Cuba
-
 Cyprus
-
 Czechia
-
 DR Congo
-
 Denmark
-
 Dominican Republic
-
 Ecuador
-
 Egypt
-
 El Salvador
-
 Estonia
-
 Eswatini
-
 Ethiopia
-
 Finland
-
 France
-
 Georgia
-
 Germany
-
 Ghana
-
 Greece
-
 Haiti
-
 Hong Kong
-
 Hungary
-
 India
-
 Indonesia
-
 Iran, Islamic republic
-
 Iraq
-
 Ireland
-
 Israel
-
 Italy
-
 Jamaica
-
 Japan
-
 Jordan
-
 Kazakhstan
-
 Kenya
-
 Korea
-
 Kuwait
-
 Kyrgyzstan
-
 Laos
-
 Latvia
-
 Lebanon
-
 Lesotho
-
 Libya
-
 Lithuania
-
 Luxembourg
-
 Madagascar
-
 Malaysia
-
 Malta
-
 Mauritius
-
 Mexico
-
 Moldova
-
 Mongolia
-
 Montenegro
-
 Morocco
-
 Mozambique
-
 Myanmar
-
 Namibia
-
 Nepal
-
 Netherlands
-
 New Zealand
-
 Nigeria
-
 North Macedonia
-
 Norway
-
 Oman
-
 Pakistan
-
 Palestine
-
 Panama
-
 Papua New Guinea
-
 Paraguay
-
 Peru
-
 Philippines
-
 Poland
-
 Portugal
-
 Puerto Rico
-
 Qatar
-
 Reunion
-
 Romania
-
 Rwanda
-
 Saudi Arabia
-
 Serbia
-
 Singapore
-
 Slovakia
-
 Slovenia
-
 Somalia
-
 South Africa
-
 Spain
-
 Sri Lanka
-
 Sweden
-
 Switzerland
-
 Syria
-
 Taiwan
-
 Tajikistan
-
 Tanzania
-
 Thailand
-
 Trinidad and Tobago
-
 Tunisia
-
 Turkey
-
 UAE
-
 Uganda
-
 Ukraine
-
 United Kingdom
-
United States
-
 Uruguay
-
 Uzbekistan
-
 Venezuela
-
 Vietnam
-
 Yemen
-
 Zambia
-
 Zimbabwe
- Forex
- Crypto












