

What's behind Ethereum's latest 5.7% price pullback?

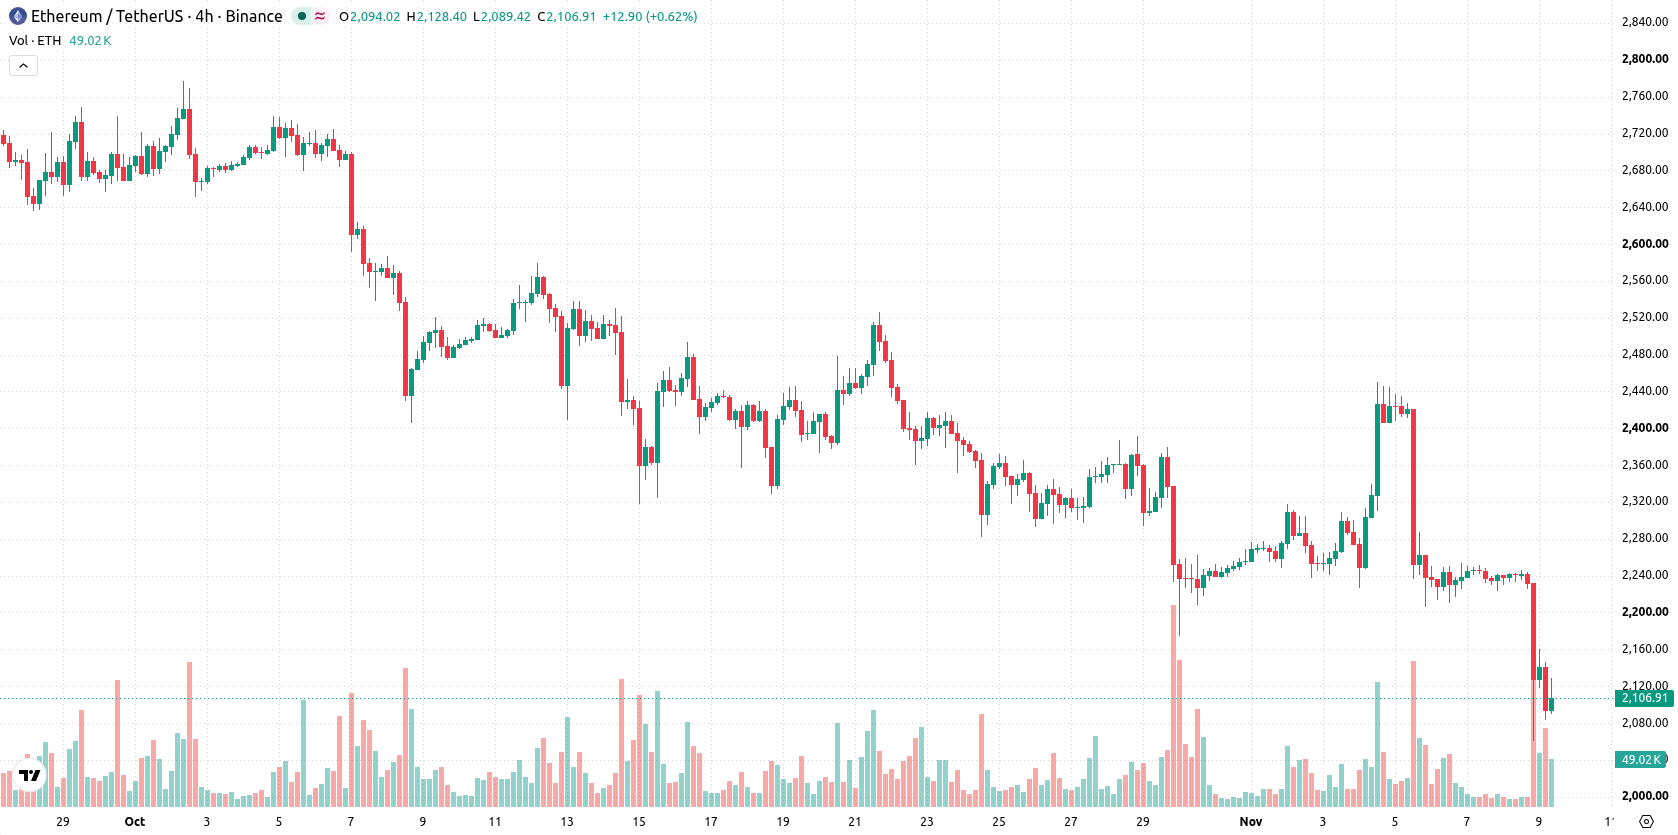
Ethereum (ETH) tumbled 5.69% after six straight weeks of outflows from U.S. spot Ethereum ETFs drove broader selling, even as continued accumulation by large holders was recorded during the price dip. The decline is reinforced by ETH trading below its 20-day, 50-day, and 200-day moving averages, signaling persistent pressure from sellers across all major timeframes.
 1813.59
2021.11
Highlights
- Ether is being positioned by co-founder Vitalik Buterin as a store of value, not relying on transaction fee burns for valuation.
- U.S. spot Ethereum ETFs registered six straight weeks of outflows totaling about $2 billion, with large investors accumulating during this time.
- ETH/USD trades below key moving averages with negative momentum signals, a projected 5-day range of $1,914 to $2,304, and high probability of further downside.
Major investor exits outweigh network strength amid shifting regulatory outlook
Ethereum co-founder Vitalik Buterin stated that Ether should be recognized primarily as a store of value rather than depending on transaction fee burns for its valuation. Over the past month, U.S. spot Ethereum ETFs recorded six consecutive weeks of outflows totaling approximately $2 billion, accompanied by accumulation from some large investors during this period. Ethereum remained the top smart contract platform by ecosystem scope, with ongoing attention to variables such as staking participation, network security, on-chain utility, decentralization, and changing global regulatory conditions, though price action has remained under broader selling pressure.
Seller control persists as negative momentum meets neutral oscillators
ETH/USD is presently trading below the 20-day, 50-day, and 200-day moving averages at $2,317, $2,485, and $2,156, respectively. This setup highlights continued seller dominance over short-, medium-, and long-term horizons, with $2,156 acting as near-term resistance and $2,083 as immediate support. The MA-50 remains above the MA-200, which retains the longer-term bullish alignment despite current weakness. Momentum signals are broadly negative, as MACD points to strong sell conditions and the ADX indicates robust prevailing trend strength. RSI, Stochastic RSI, and CCI are all neutral, suggesting no overbought or oversold risk is present according to these indicators. Bull/Bear Power shows sellers in control, while the Awesome Oscillator signals neutrality. Price currently sits mid-range amid 3.72% daily volatility, with intraday flows confirming lasting downside pressure after the open. Divergence is evident, as neutral oscillators contrast with negative momentum and strong selling activity.
Previously it was reported that privacy-focused stablecoin payment solutions were expanding on Ethereum, highlighting continued innovation in on-chain financial products despite broader industry volatility. The current sustained outflows and downside trading pressure add a cautionary backdrop, making a close monitoring of the $2,083 support level critical for traders assessing further downside risk in the coming week.











-
 Afghanistan
-
 Albania
-
 Algeria
-
 Angola
-
 Argentina
-
 Armenia
-
 Australia
-
 Austria
-
 Azerbaijan
-
 Bahamas
-
 Bahrain
-
 Bangladesh
-
 Belarus
-
 Belgium
-
 Bolivia
-
 Botswana
-
 Brazil
-
 Brunei
-
 Bulgaria
-
 Cambodia
-
 Cameroon
-
 Canada
-
 Chile
-
 China
-
 Colombia
-
 Congo
-
 Costa Rica
-
 Cote d'Ivoire
-
 Croatia
-
 Cuba
-
 Cyprus
-
 Czechia
-
 DR Congo
-
 Denmark
-
 Dominican Republic
-
 Ecuador
-
 Egypt
-
 El Salvador
-
 Estonia
-
 Eswatini
-
 Ethiopia
-
 Finland
-
 France
-
 Georgia
-
 Germany
-
 Ghana
-
 Greece
-
 Haiti
-
 Hong Kong
-
 Hungary
-
 India
-
 Indonesia
-
 Iran, Islamic republic
-
 Iraq
-
 Ireland
-
 Israel
-
 Italy
-
 Jamaica
-
 Japan
-
 Jordan
-
 Kazakhstan
-
 Kenya
-
 Korea
-
 Kuwait
-
 Kyrgyzstan
-
 Laos
-
 Latvia
-
 Lebanon
-
 Lesotho
-
 Libya
-
 Lithuania
-
 Luxembourg
-
 Madagascar
-
 Malaysia
-
 Malta
-
 Mauritius
-
 Mexico
-
 Moldova
-
 Mongolia
-
 Montenegro
-
 Morocco
-
 Mozambique
-
 Myanmar
-
 Namibia
-
 Nepal
-
 Netherlands
-
 New Zealand
-
 Nigeria
-
 North Macedonia
-
 Norway
-
 Oman
-
 Pakistan
-
 Palestine
-
 Panama
-
 Papua New Guinea
-
 Paraguay
-
 Peru
-
 Philippines
-
 Poland
-
 Portugal
-
 Puerto Rico
-
 Qatar
-
 Reunion
-
 Romania
-
 Rwanda
-
 Saudi Arabia
-
 Serbia
-
 Singapore
-
 Slovakia
-
 Slovenia
-
 Somalia
-
 South Africa
-
 Spain
-
 Sri Lanka
-
 Sweden
-
 Switzerland
-
 Syria
-
 Taiwan
-
 Tajikistan
-
 Tanzania
-
 Thailand
-
 Trinidad and Tobago
-
 Tunisia
-
 Turkey
-
 UAE
-
 Uganda
-
 Ukraine
-
 United Kingdom
-
United States
-
 Uruguay
-
 Uzbekistan
-
 Venezuela
-
 Vietnam
-
 Yemen
-
 Zambia
-
 Zimbabwe
- Forex
- Crypto












