

Bitcoin price holds above $69,055 support amid mixed technical signals and increased exchange inflows

Bitcoin (BTC) is trading at $73,619 after a modest decline in the latest session. The price movements place BTC below its key short- and medium-term averages while still preserving longer-term support.
 62255.12
68446.21
Highlights
- Bitcoin Core developers patched three security vulnerabilities, including one high-severity issue affecting mining nodes, with all fixes deployed by October 2025.
- US spot Bitcoin ETFs continue to see outflows and miner reserves are declining, increasing near-term supply in the market.
- BTC/USD trades below key moving averages and momentum is bearish, with expected range of $69,055 to $74,444 and very low probability of an upward move.
ETF outflows and miner reserve drop as security patch reduces systemic risk
Bitcoin Core developers have recently addressed and patched three security vulnerabilities, including one considered high-severity for mining nodes, with all updates implemented by October 2025, according to Coin Turk. This comprehensive remediation reduces systemic risk and provides reassurance to node operators and the broader market. Meanwhile, data from Crypto highlights ongoing outflows from US spot Bitcoin ETFs and elevated exchange inflows, coinciding with a decline in miner reserves. These shifts suggest increased near-term supply and may contribute to current market dynamics.
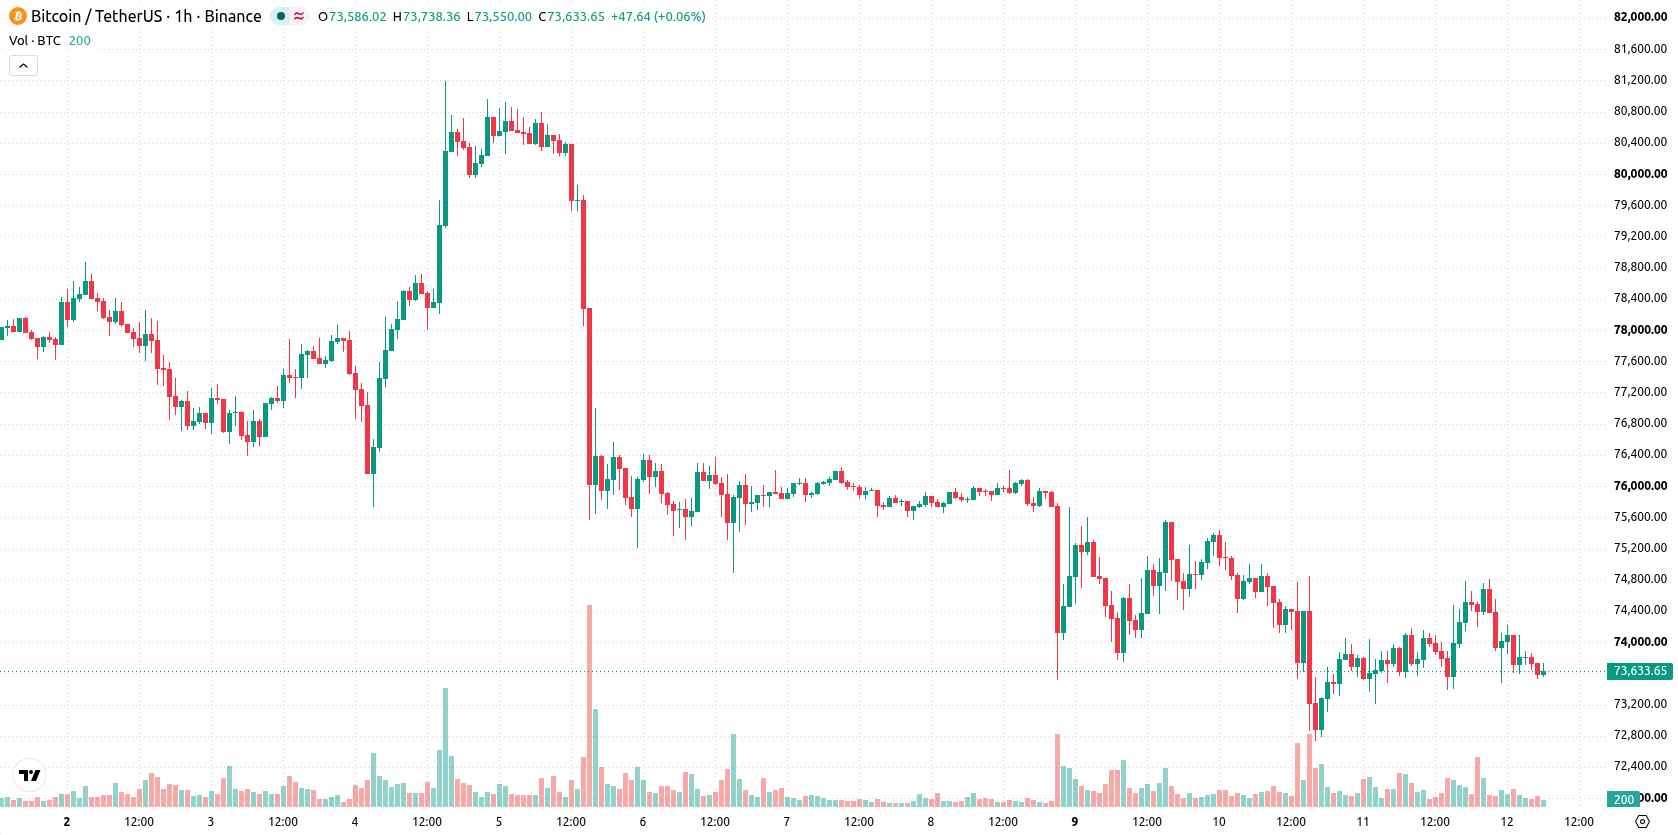
Short-term selling persists as resistance holds and oscillators diverge
On the technical front, BTC is trading below the MA-20 and MA-50 on the h1 timeframe, indicating intraday selling interest, yet holding above the MA-200 on the daily chart. Immediate resistance stands at the Ichimoku Kijun level of $74,100. Oscillator readings are mixed: while MACD and Awesome Oscillator convey a bearish bias, ADX is neutral. RSI remains in the neutral zone, but Stochastic RSI and CCI are both oversold, hinting at possible short-term exhaustion of selling pressure. Additionally, Bull/Bear Power is negative, reflecting sellers' dominance within the session.
Bearish bias persists as price faces downside risks in range
In the near term, BTC is likely to remain within a volatility band between $69,055 and $74,444, with probabilities favoring further downside. The scenario baseline points to range-bound action inside this corridor, while a decisive move above $74,100 would be required for a bullish reversal. Conversely, failure to hold above support levels could expose the price to additional declines toward the lower end of the expected range.
Previously it was reported that derivatives and options markets had turned more defensive on bitcoin, with traders expressing caution over potential downside risks. The current environment introduces a fresh variable in the form of heightened blockchain security and evolving ETF and miner flows, making the $74,100 level a pivotal threshold to watch for signals of either renewed upward momentum or an extension of the prevailing range-bound pattern.











-
 Afghanistan
-
 Albania
-
 Algeria
-
 Angola
-
 Argentina
-
 Armenia
-
 Australia
-
 Austria
-
 Azerbaijan
-
 Bahamas
-
 Bahrain
-
 Bangladesh
-
 Belarus
-
 Belgium
-
 Bolivia
-
 Botswana
-
 Brazil
-
 Brunei
-
 Bulgaria
-
 Cambodia
-
 Cameroon
-
 Canada
-
 Chile
-
 China
-
 Colombia
-
 Congo
-
 Costa Rica
-
 Cote d'Ivoire
-
 Croatia
-
 Cuba
-
 Cyprus
-
 Czechia
-
 DR Congo
-
 Denmark
-
 Dominican Republic
-
 Ecuador
-
 Egypt
-
 El Salvador
-
 Estonia
-
 Eswatini
-
 Ethiopia
-
 Finland
-
 France
-
 Georgia
-
 Germany
-
 Ghana
-
 Greece
-
 Haiti
-
 Hong Kong
-
 Hungary
-
 India
-
 Indonesia
-
 Iran, Islamic republic
-
 Iraq
-
 Ireland
-
 Israel
-
 Italy
-
 Jamaica
-
 Japan
-
 Jordan
-
 Kazakhstan
-
 Kenya
-
 Korea
-
 Kuwait
-
 Kyrgyzstan
-
 Laos
-
 Latvia
-
 Lebanon
-
 Lesotho
-
 Libya
-
 Lithuania
-
 Luxembourg
-
 Madagascar
-
 Malaysia
-
 Malta
-
 Mauritius
-
 Mexico
-
 Moldova
-
 Mongolia
-
 Montenegro
-
 Morocco
-
 Mozambique
-
 Myanmar
-
 Namibia
-
 Nepal
-
 Netherlands
-
 New Zealand
-
 Nigeria
-
 North Macedonia
-
 Norway
-
 Oman
-
 Pakistan
-
 Palestine
-
 Panama
-
 Papua New Guinea
-
 Paraguay
-
 Peru
-
 Philippines
-
 Poland
-
 Portugal
-
 Puerto Rico
-
 Qatar
-
 Reunion
-
 Romania
-
 Rwanda
-
 Saudi Arabia
-
 Serbia
-
 Singapore
-
 Slovakia
-
 Slovenia
-
 Somalia
-
 South Africa
-
 Spain
-
 Sri Lanka
-
 Sweden
-
 Switzerland
-
 Syria
-
 Taiwan
-
 Tajikistan
-
 Tanzania
-
 Thailand
-
 Trinidad and Tobago
-
 Tunisia
-
 Turkey
-
 UAE
-
 Uganda
-
 Ukraine
-
 United Kingdom
-
United States
-
 Uruguay
-
 Uzbekistan
-
 Venezuela
-
 Vietnam
-
 Yemen
-
 Zambia
-
 Zimbabwe
- Forex
- Crypto












