

What's behind Bitcoin's latest 5.9% price pullback?

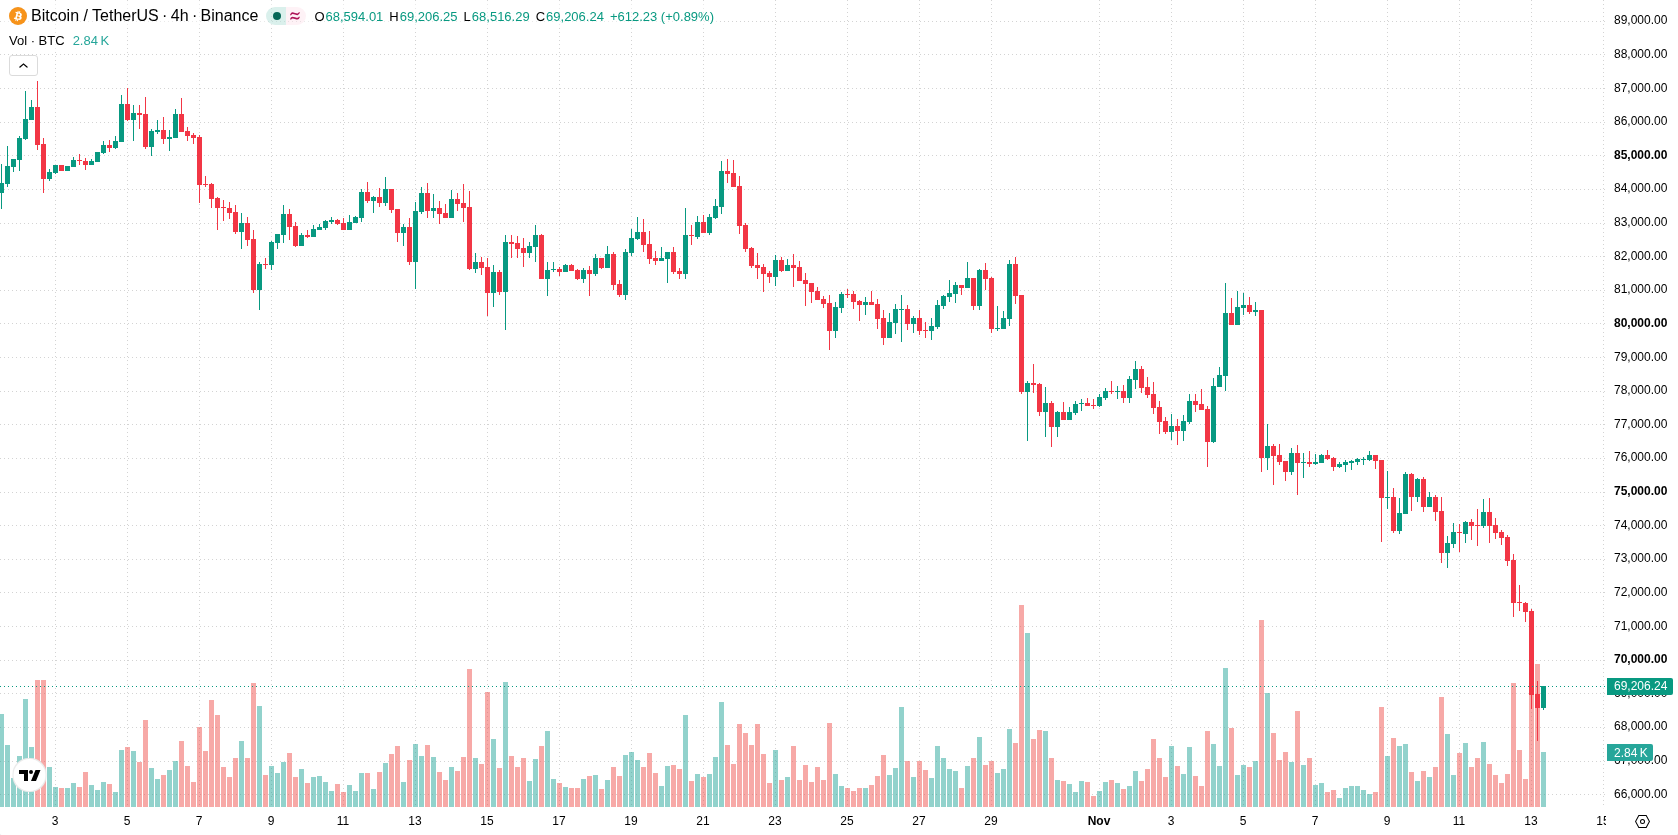
Bitcoin (BTC) fell 5.89% after large outflows from US spot Bitcoin ETFs signaled a retreat in investor risk appetite. The move is further supported by the cryptocurrency trading below all key moving averages, confirming strong short- and medium-term bearish momentum.
 68446.21
76200.00
Highlights
- US spot Bitcoin ETFs saw outflows totaling about $1.44 billion, with major redemptions from BlackRock and Grayscale trusts.
- The US Treasury announced a formal custody framework for its government-held Bitcoin, covering assets between 198,000 and over 328,000 BTC.
- BTC/USD trades below all key moving averages, with strong downside momentum and a five-session range expected from $66,107 to $71,696.
ETF redemptions and miner sales reshape bitcoin supply signals
Significant outflows were reported from US spot Bitcoin ETFs, including substantial redemptions in BlackRock's iShares Bitcoin Trust and Grayscale's Bitcoin Trust, totaling approximately $1.44 billion over several days. The US Treasury disclosed the development of a formal custody framework for its government-held Bitcoin, addressing security and oversight of assets ranging from roughly 198,000 to over 328,000 BTC. Some Bitcoin miners and treasury firms also sold portions of their reserves to cover debts and operational needs, impacting supply dynamics within the ecosystem.
Bearish momentum persists as price breaks technical supports
BTC/USD trades below all key moving averages, with the current price at $69,127 compared to the MA-20 at $77,345, MA-50 at $80,948, and MA-200 at $73,137. This structure signals strong bearish momentum in both the short and medium term, with even the longer-term outlook under pressure. The nearest resistance is seen at $71,113, while immediate support is at $67,568. Although the MA-50 remains above the MA-200, confirming the previously established uptrend, this alignment is now in jeopardy. Momentum indicators show consistent downside pressure: both MACD and ADX forecast further selling, and the RSI, Stochastic RSI, and CCI are in their verified oversold zones, highlighting potential for a technical rebound but not a reversal. Additional indicators such as BBP and the Awesome Oscillator remain negative, and intraday volatility stands at 5.84%, confirming strong two-way action with a prevailing tone of sustained selling pressure.
Earlier, analysts noted that Bitcoin remained highly sensitive to U.S. macroeconomic factors and was pressured by tightening monetary policy. The latest wave of ETF outflows and institutional sales adds to structural supply-side pressures, making the $66,107 support level the critical threshold to monitor for potential further declines.











-
 Afghanistan
-
 Albania
-
 Algeria
-
 Angola
-
 Argentina
-
 Armenia
-
 Australia
-
 Austria
-
 Azerbaijan
-
 Bahamas
-
 Bahrain
-
 Bangladesh
-
 Belarus
-
 Belgium
-
 Bolivia
-
 Botswana
-
 Brazil
-
 Brunei
-
 Bulgaria
-
 Cambodia
-
 Cameroon
-
 Canada
-
 Chile
-
 China
-
 Colombia
-
 Congo
-
 Costa Rica
-
 Cote d'Ivoire
-
 Croatia
-
 Cuba
-
 Cyprus
-
 Czechia
-
 DR Congo
-
 Denmark
-
 Dominican Republic
-
 Ecuador
-
 Egypt
-
 El Salvador
-
 Estonia
-
 Eswatini
-
 Ethiopia
-
 Finland
-
 France
-
 Georgia
-
 Germany
-
 Ghana
-
 Greece
-
 Haiti
-
 Hong Kong
-
 Hungary
-
 India
-
 Indonesia
-
 Iran, Islamic republic
-
 Iraq
-
 Ireland
-
 Israel
-
 Italy
-
 Jamaica
-
 Japan
-
 Jordan
-
 Kazakhstan
-
 Kenya
-
 Korea
-
 Kuwait
-
 Kyrgyzstan
-
 Laos
-
 Latvia
-
 Lebanon
-
 Lesotho
-
 Libya
-
 Lithuania
-
 Luxembourg
-
 Madagascar
-
 Malaysia
-
 Malta
-
 Mauritius
-
 Mexico
-
 Moldova
-
 Mongolia
-
 Montenegro
-
 Morocco
-
 Mozambique
-
 Myanmar
-
 Namibia
-
 Nepal
-
 Netherlands
-
 New Zealand
-
 Nigeria
-
 North Macedonia
-
 Norway
-
 Oman
-
 Pakistan
-
 Palestine
-
 Panama
-
 Papua New Guinea
-
 Paraguay
-
 Peru
-
 Philippines
-
 Poland
-
 Portugal
-
 Puerto Rico
-
 Qatar
-
 Reunion
-
 Romania
-
 Rwanda
-
 Saudi Arabia
-
 Serbia
-
 Singapore
-
 Slovakia
-
 Slovenia
-
 Somalia
-
 South Africa
-
 Spain
-
 Sri Lanka
-
 Sweden
-
 Switzerland
-
 Syria
-
 Taiwan
-
 Tajikistan
-
 Tanzania
-
 Thailand
-
 Trinidad and Tobago
-
 Tunisia
-
 Turkey
-
 UAE
-
 Uganda
-
 Ukraine
-
 United Kingdom
-
United States
-
 Uruguay
-
 Uzbekistan
-
 Venezuela
-
 Vietnam
-
 Yemen
-
 Zambia
-
 Zimbabwe
- Forex
- Crypto












