

Render Network burns $792,486 in tokens: Can RENDER sustain its bullish momentum?

Render (RENDER) is trading at $1.477 after gaining 7.97% over the last day. The price is currently positioned above its key short- and medium-term moving averages, highlighting strong intraday momentum.
 1.447
1.6400
Highlights
- Render Network gross job fees climbed to $834,203 in October, indicating rising demand for decentralized GPU computing services.
- $792,486 worth of RENDER tokens were permanently burned in October, reducing circulating supply and directly supporting token value.
- RENDER trades with firm short-term bullish momentum and is projected to move within a $1.4034 to $1.5506 range over the next 2 to 3 days.
Rising job fees and supply controls boost token’s demand outlook
Render Network's gross job fees rose to $834,203 in October, signaling sharply higher demand for decentralized GPU computing services and boosting transaction-driven interest in RENDER. The month saw a substantial $792,486 in tokens permanently burned through fee mechanisms, driving down circulating supply and providing direct support to the token's value. The ongoing 5.9 million RENDER emissions budget, which extends through December 19, 2026 according to Tokenpost, gives clear supply visibility and strengthens the platform's medium-term token economics.
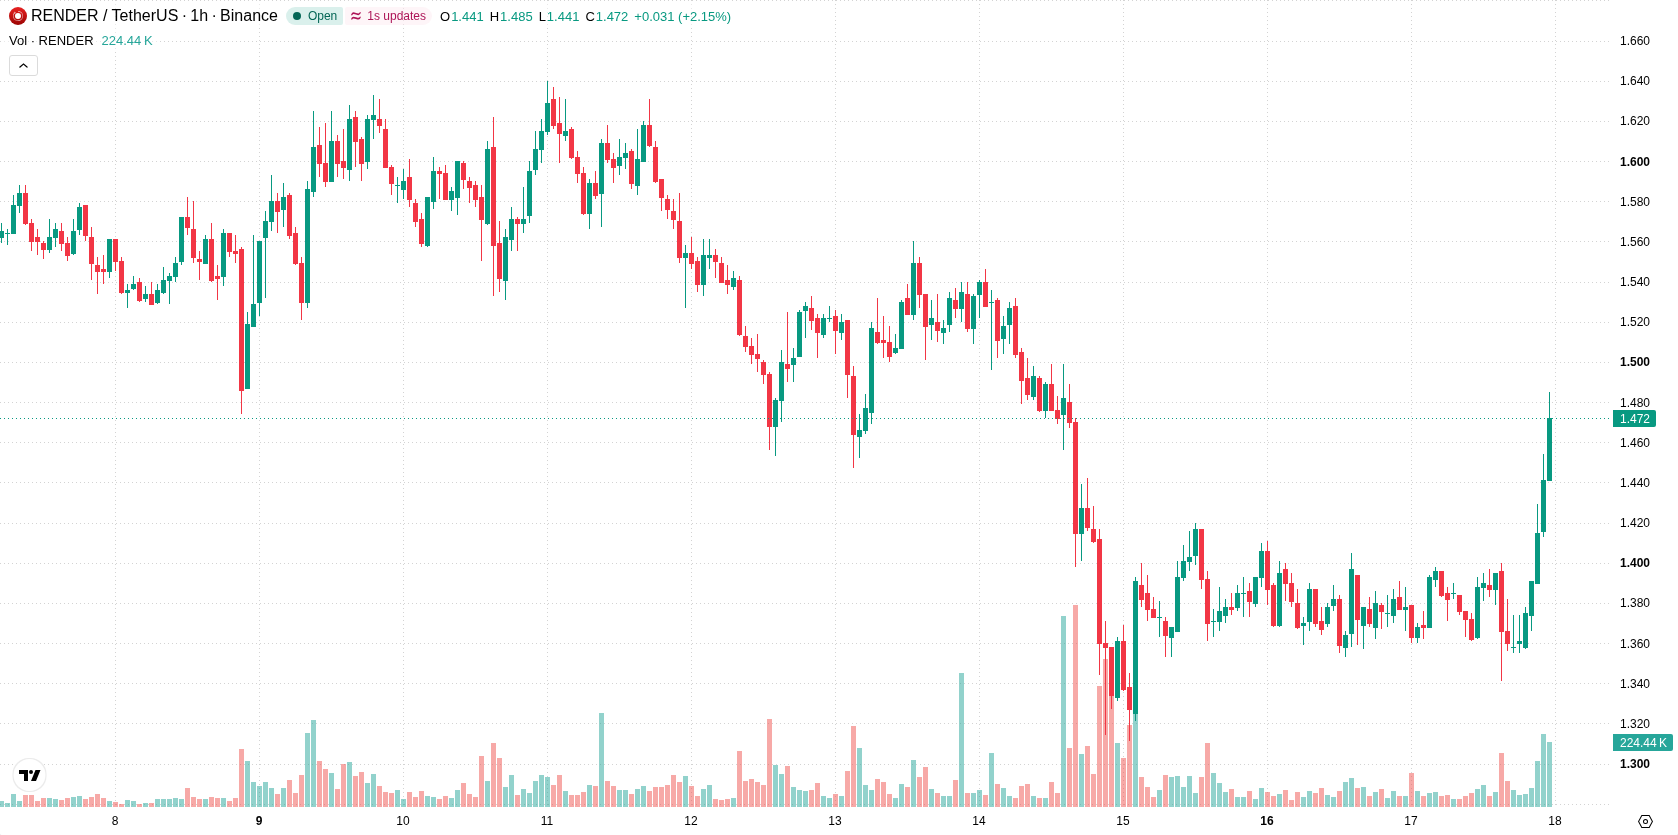
Overbought risk emerges as bullish momentum tests daily resistance
On the hourly chart, RENDER/USD is trading above the H1 SMA-20 at $1.3836 and the H1 SMA-50 at $1.3801, confirming the price's dominance over short- and medium-term support levels. The D1 SMA-200 at $1.6526 remains overhead as a key resistance level. The Ichimoku Kijun is providing immediate support at $1.394. MACD has issued a buy signal, while ADX is neutral. RSI is neutral, but both Stoch RSI and CCI are flashing overbought readings, which, alongside a positive Bull/Bear Power at 0.0579, indicate intraday buyer strength but also highlight overheating risks. The Awesome Oscillator is neutral. The recent surge has pushed RENDER close to the top of its daily range during a notably volatile session, and while momentum is bullish, mixed oscillator signals urge traders to be cautious about potential pullbacks.
Bullish short-term bias as price eyes consolidation or breakout
Over the next 2 to 3 trading days, RENDER is projected to fluctuate within a band of $1.4034 to $1.5506, reflecting typical volatility around current levels. The probability of an upward move stands at 76%, compared to a 24% chance of a downside move, suggesting that further gains are more likely in the short term. The baseline scenario envisions price consolidation within this corridor, with a bullish scenario possible if RENDER breaks decisively above $1.5506. A bearish scenario would be triggered should the price slip below immediate support at the Ichimoku Kijun.
Earlier, analysts noted that downside risk dominated for Render due to persistent bearish momentum and ongoing support tests. The current technical setup signals a shift, with bullish momentum surfacing and a projected trading range of $1.4034 to $1.5506 now key for short-term positioning.









-
 Afghanistan
-
 Albania
-
 Algeria
-
 Angola
-
 Argentina
-
 Armenia
-
 Australia
-
 Austria
-
 Azerbaijan
-
 Bahamas
-
 Bahrain
-
 Bangladesh
-
 Belarus
-
 Belgium
-
 Bolivia
-
 Botswana
-
 Brazil
-
 Brunei
-
 Bulgaria
-
 Cambodia
-
 Cameroon
-
 Canada
-
 Chile
-
 China
-
 Colombia
-
 Congo
-
 Costa Rica
-
 Cote d'Ivoire
-
 Croatia
-
 Cuba
-
 Cyprus
-
 Czechia
-
 DR Congo
-
 Denmark
-
 Dominican Republic
-
 Ecuador
-
 Egypt
-
 El Salvador
-
 Estonia
-
 Eswatini
-
 Ethiopia
-
 Finland
-
 France
-
 Georgia
-
 Germany
-
 Ghana
-
 Greece
-
 Haiti
-
 Hong Kong
-
 Hungary
-
 India
-
 Indonesia
-
 Iran, Islamic republic
-
 Iraq
-
 Ireland
-
 Israel
-
 Italy
-
 Jamaica
-
 Japan
-
 Jordan
-
 Kazakhstan
-
 Kenya
-
 Korea
-
 Kuwait
-
 Kyrgyzstan
-
 Laos
-
 Latvia
-
 Lebanon
-
 Lesotho
-
 Libya
-
 Lithuania
-
 Luxembourg
-
 Madagascar
-
 Malaysia
-
 Malta
-
 Mauritius
-
 Mexico
-
 Moldova
-
 Mongolia
-
 Montenegro
-
 Morocco
-
 Mozambique
-
 Myanmar
-
 Namibia
-
 Nepal
-
 Netherlands
-
 New Zealand
-
 Nigeria
-
 North Macedonia
-
 Norway
-
 Oman
-
 Pakistan
-
 Palestine
-
 Panama
-
 Papua New Guinea
-
 Paraguay
-
 Peru
-
 Philippines
-
 Poland
-
 Portugal
-
 Puerto Rico
-
 Qatar
-
 Reunion
-
 Romania
-
 Rwanda
-
 Saudi Arabia
-
 Serbia
-
 Singapore
-
 Slovakia
-
 Slovenia
-
 Somalia
-
 South Africa
-
 Spain
-
 Sri Lanka
-
 Sweden
-
 Switzerland
-
 Syria
-
 Taiwan
-
 Tajikistan
-
 Tanzania
-
 Thailand
-
 Trinidad and Tobago
-
 Tunisia
-
 Turkey
-
 UAE
-
 Uganda
-
 Ukraine
-
 United Kingdom
-
United States
-
 Uruguay
-
 Uzbekistan
-
 Venezuela
-
 Vietnam
-
 Yemen
-
 Zambia
-
 Zimbabwe
- Forex
- Crypto












