

Ethereum weekly outlook: Support comes into focus after a stretched decline as spot ETF outflows pressure sentiment

Ethereum (ETH) is trading near $1,810 after a drop of more than 10% this week, as persistent outflows from U.S. spot ETFs drive notable volatility. With sentiment pressured by declining institutional flows, attention in the coming days turns to whether technical support will hold amid ongoing uncertainty.
 1817.57
2021.11
Highlights
- Ethereum trades at $1,810, down 11.87% over 7 days and below all key moving averages.
- Major technical indicators show strong bearish momentum and oversold conditions, with low probability of a near-term reversal.
- Ethereum is projected to remain under pressure in a $1,622 to $1,998 range, with key support at $1,711 and resistance at $2,066.
ETF withdrawals and tech sector swings drive risk-off sentiment this week
Large outflows from spot Ether ETFs dominated headlines last week, with nearly $398.9 million in withdrawals highlighting continued investor caution according to crypto.news. Secondary pressure came from broader risk moves linked to Nvidia stock volatility and anticipation ahead of the Anthropic IPO, as reported by Decrypt. Meanwhile, Ethereum developers warned that the upcoming Glamsterdam network upgrade may disrupt up to 15,000 smart contracts due to changes in gas rules, based on updates from Decrypt and CryptoBriefing.
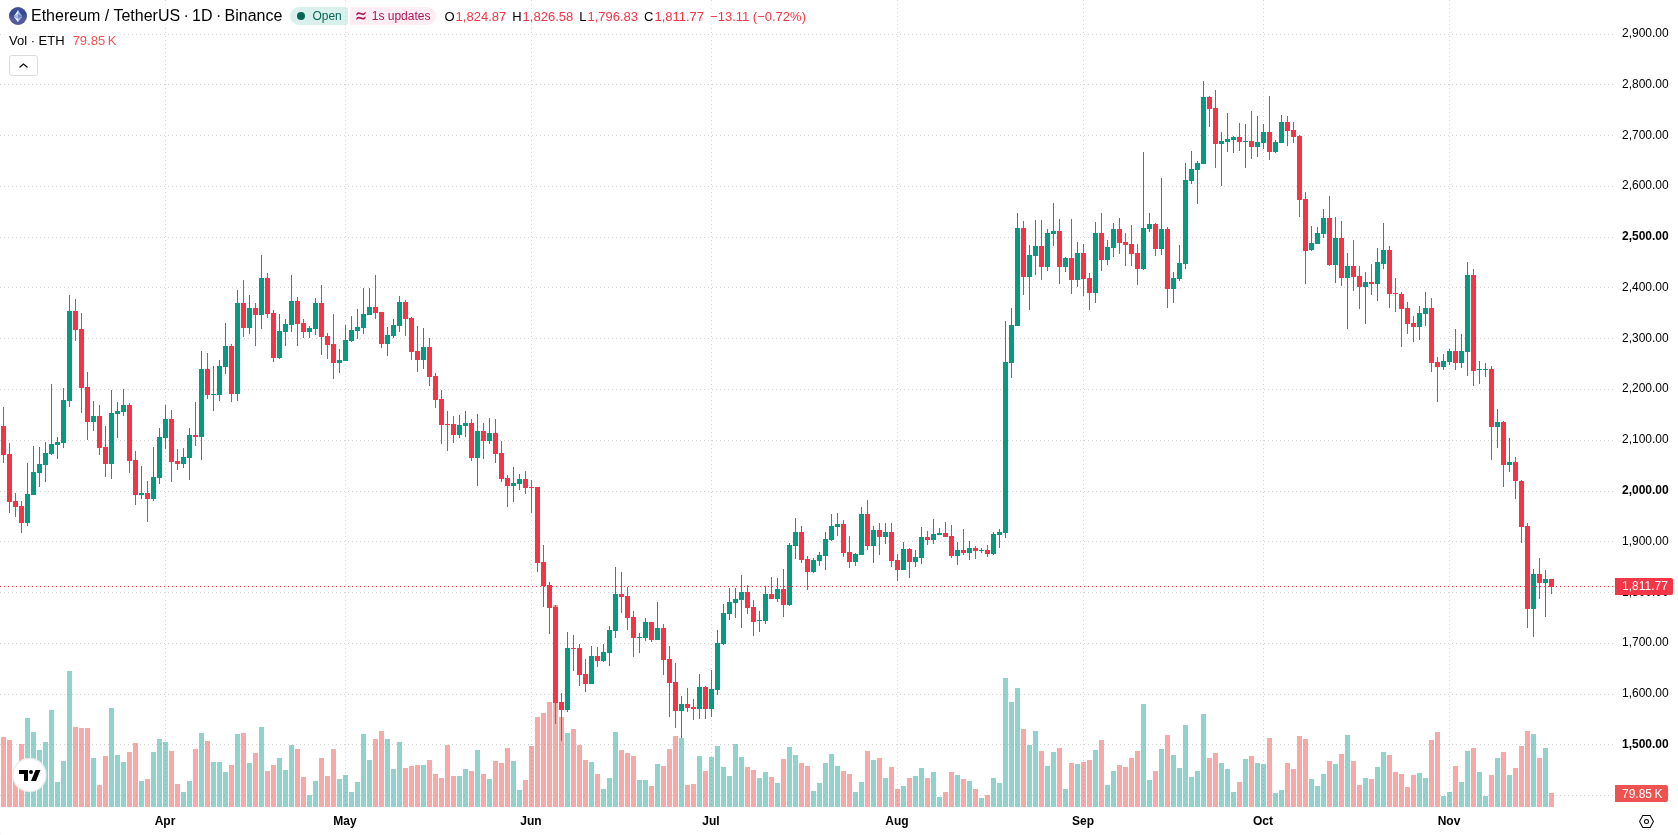
Bearish momentum persists as oscillators flag deep oversold conditions
The daily chart reveals a firm downtrend, with momentum characterized as a sustained move lower with a firm trend and 20.77% volatility. All level-based oscillators—including RSI at 24.95, CCI at -132.42, and Stochastic RSI at 16.43—signal oversold conditions, highlighting potential selling exhaustion but not a guaranteed reversal. MACD and the Awesome Oscillator both support further downside, aligning with the dominant bearish momentum. Nearest support is at $1,711, while resistance stands at $2,066, with the Ichimoku Kijun at $2,080 also acting as resistance.
Further downside favored unless resistance breaks above forecasted range
For the next 7 days, Ethereum is expected to trade between $1,622 and $1,998. There is a very low probability (less than 20%) of an increase and a very high probability (more than 80%) of a further decline. The base case is continued pressure inside the forecast range, with a decisive push above $2,066 resistance required to challenge the downtrend. If support at $1,711 fails, a move toward the lower end of the expected range becomes likely.
Earlier, analysts noted that Ethereum's recovery prospects remained limited by persistent ETF outflows and cautious institutional sentiment. With recent technical and fundamental pressures intensifying, traders should closely monitor the $1,711 support level, as a break below this threshold could accelerate downside toward the lower end of the forecast range.










-
 Afghanistan
-
 Albania
-
 Algeria
-
 Angola
-
 Argentina
-
 Armenia
-
 Australia
-
 Austria
-
 Azerbaijan
-
 Bahamas
-
 Bahrain
-
 Bangladesh
-
 Belarus
-
 Belgium
-
 Bolivia
-
 Botswana
-
 Brazil
-
 Brunei
-
 Bulgaria
-
 Cambodia
-
 Cameroon
-
 Canada
-
 Chile
-
 China
-
 Colombia
-
 Congo
-
 Costa Rica
-
 Cote d'Ivoire
-
 Croatia
-
 Cuba
-
 Cyprus
-
 Czechia
-
 DR Congo
-
 Denmark
-
 Dominican Republic
-
 Ecuador
-
 Egypt
-
 El Salvador
-
 Estonia
-
 Eswatini
-
 Ethiopia
-
 Finland
-
 France
-
 Georgia
-
 Germany
-
 Ghana
-
 Greece
-
 Haiti
-
 Hong Kong
-
 Hungary
-
 India
-
 Indonesia
-
 Iran, Islamic republic
-
 Iraq
-
 Ireland
-
 Israel
-
 Italy
-
 Jamaica
-
 Japan
-
 Jordan
-
 Kazakhstan
-
 Kenya
-
 Korea
-
 Kuwait
-
 Kyrgyzstan
-
 Laos
-
 Latvia
-
 Lebanon
-
 Lesotho
-
 Libya
-
 Lithuania
-
 Luxembourg
-
 Madagascar
-
 Malaysia
-
 Malta
-
 Mauritius
-
 Mexico
-
 Moldova
-
 Mongolia
-
 Montenegro
-
 Morocco
-
 Mozambique
-
 Myanmar
-
 Namibia
-
 Nepal
-
 Netherlands
-
 New Zealand
-
 Nigeria
-
 North Macedonia
-
 Norway
-
 Oman
-
 Pakistan
-
 Palestine
-
 Panama
-
 Papua New Guinea
-
 Paraguay
-
 Peru
-
 Philippines
-
 Poland
-
 Portugal
-
 Puerto Rico
-
 Qatar
-
 Reunion
-
 Romania
-
 Rwanda
-
 Saudi Arabia
-
 Serbia
-
 Singapore
-
 Slovakia
-
 Slovenia
-
 Somalia
-
 South Africa
-
 Spain
-
 Sri Lanka
-
 Sweden
-
 Switzerland
-
 Syria
-
 Taiwan
-
 Tajikistan
-
 Tanzania
-
 Thailand
-
 Trinidad and Tobago
-
 Tunisia
-
 Turkey
-
 UAE
-
 Uganda
-
 Ukraine
-
 United Kingdom
-
United States
-
 Uruguay
-
 Uzbekistan
-
 Venezuela
-
 Vietnam
-
 Yemen
-
 Zambia
-
 Zimbabwe
- Forex
- Crypto












