

Maple technical analysis: Downward price move persists under seller pressure

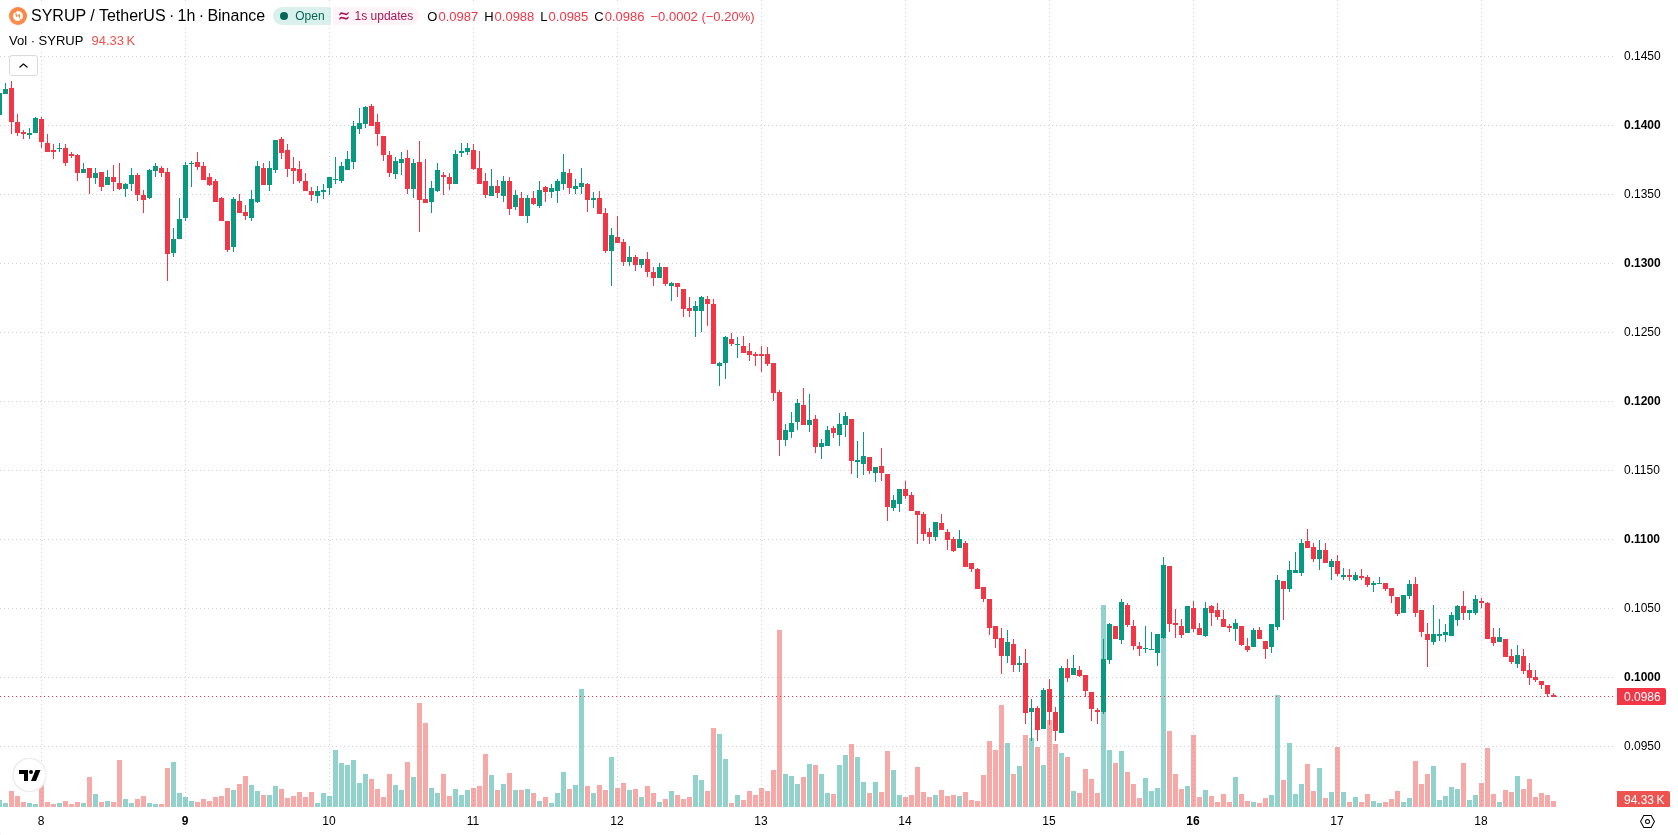
Maple (SYRUP) is trading at $0.0988 after a steep daily decline of 6.97%. The price remains below its key moving averages, highlighting continued downward momentum in both the short and long term.
 0.102
0.1240
Highlights
- Maple Finance's syrupUSDC assets under management fell from $2.36 billion to $2.17 billion between November 10 and November 18, 2026.
- October's SYRUP token buyback reached $146,535, down sharply from $314,116 in September, reducing direct support for the token price.
- SYRUP/USD trades below key moving averages with strong bearish momentum; expected range is $0.0903 to $0.1073 and downward continuation is very likely.
Capital outflows and reduced buybacks weigh on market sentiment
Maple Finance's syrupUSDC assets under management fell from $2.36 billion on November 10 to $2.17 billion by November 18, 2026, reflecting a substantial outflow from the platform's core lending products, according to Phemex. Parallel declines in syrupUSDT managed assets, down to $515.16 million over the same period per Phemex, further underscore a broad contraction in available platform capital that may put pressure on market liquidity and sentiment. October's 1.08 million SYRUP token buyback totaled $146,535, a marked reduction from September's $314,116 figure reported by Techflowpost, limiting direct support for the token price. Commenting on company operations, Maple Finance CEO Sid Powell stated on November 17, 2026, that the loan book remains healthy and that recent executive departures were unrelated to business fundamentals, as reported by Cryptobriefing.
Bearish momentum persists as oversold signals allow brief rebound
On the technical front, SYRUP/USD is trading below the H1 SMA-20 at $0.1025 and the H1 SMA-50 at $0.1048, as well as significantly under the D1 SMA-200 at $0.1823. The Ichimoku Kijun at $0.1029 stands as immediate resistance. Momentum indicators are negative, with MACD and ADX signaling sell conditions. RSI, Stoch RSI, and CCI are each firmly in oversold territory, suggesting scope for a short-lived rebound rather than a trend reversal. Bearish dominance persists, as shown by a negative Bull/Bear Power reading of -0.0018 and further confirmed by the Awesome Oscillator remaining in negative territory.
Downside continuation likely as consolidation persists near session lows
In the short term, price is expected to consolidate within a volatility band of $0.0903 to $0.1073. The projected probability for an upward move is rated very low, while a continuation to the downside appears much more likely. Consolidation near session lows may persist unless a bullish break above resistance targets higher levels, but if price breaks support, renewed selling could extend the decline.
Previously it was reported that Maple Finance aimed to expand its institutional lending footprint and diversify into tokenized assets as part of its long-term growth strategy. However, current on-chain data showing persistent asset outflows and limited token buyback activity now heightens downside risk, making sustained consolidation below $0.10 a key scenario to monitor.










-
 Afghanistan
-
 Albania
-
 Algeria
-
 Angola
-
 Argentina
-
 Armenia
-
 Australia
-
 Austria
-
 Azerbaijan
-
 Bahamas
-
 Bahrain
-
 Bangladesh
-
 Belarus
-
 Belgium
-
 Bolivia
-
 Botswana
-
 Brazil
-
 Brunei
-
 Bulgaria
-
 Cambodia
-
 Cameroon
-
 Canada
-
 Chile
-
 China
-
 Colombia
-
 Congo
-
 Costa Rica
-
 Cote d'Ivoire
-
 Croatia
-
 Cuba
-
 Cyprus
-
 Czechia
-
 DR Congo
-
 Denmark
-
 Dominican Republic
-
 Ecuador
-
 Egypt
-
 El Salvador
-
 Estonia
-
 Eswatini
-
 Ethiopia
-
 Finland
-
 France
-
 Georgia
-
 Germany
-
 Ghana
-
 Greece
-
 Haiti
-
 Hong Kong
-
 Hungary
-
 India
-
 Indonesia
-
 Iran, Islamic republic
-
 Iraq
-
 Ireland
-
 Israel
-
 Italy
-
 Jamaica
-
 Japan
-
 Jordan
-
 Kazakhstan
-
 Kenya
-
 Korea
-
 Kuwait
-
 Kyrgyzstan
-
 Laos
-
 Latvia
-
 Lebanon
-
 Lesotho
-
 Libya
-
 Lithuania
-
 Luxembourg
-
 Madagascar
-
 Malaysia
-
 Malta
-
 Mauritius
-
 Mexico
-
 Moldova
-
 Mongolia
-
 Montenegro
-
 Morocco
-
 Mozambique
-
 Myanmar
-
 Namibia
-
 Nepal
-
 Netherlands
-
 New Zealand
-
 Nigeria
-
 North Macedonia
-
 Norway
-
 Oman
-
 Pakistan
-
 Palestine
-
 Panama
-
 Papua New Guinea
-
 Paraguay
-
 Peru
-
 Philippines
-
 Poland
-
 Portugal
-
 Puerto Rico
-
 Qatar
-
 Reunion
-
 Romania
-
 Rwanda
-
 Saudi Arabia
-
 Serbia
-
 Singapore
-
 Slovakia
-
 Slovenia
-
 Somalia
-
 South Africa
-
 Spain
-
 Sri Lanka
-
 Sweden
-
 Switzerland
-
 Syria
-
 Taiwan
-
 Tajikistan
-
 Tanzania
-
 Thailand
-
 Trinidad and Tobago
-
 Tunisia
-
 Turkey
-
 UAE
-
 Uganda
-
 Ukraine
-
 United Kingdom
-
United States
-
 Uruguay
-
 Uzbekistan
-
 Venezuela
-
 Vietnam
-
 Yemen
-
 Zambia
-
 Zimbabwe
- Forex
- Crypto












