


Synthetix (SNX) surged 10.07% in a session led by strong intraday momentum, as traders responded to a decisive upside gap and elevated volatility. The rebound looks limited, with SNX still positioned below its 50-day and 200-day moving averages, keeping the broader trend in bearish alignment.
 0.1709
0.1662
Highlights
- SNX/USD is trading above its near-term average but remains below key medium- and long-term averages, indicating ongoing seller pressure.
- Momentum indicators are mostly negative or neutral, with the Stochastic RSI in the overbought zone and daily volatility elevated at 9.34%.
- The expected range for the next five days is $0.1484 to $0.1817, with a high probability of a downward move and a sideways baseline scenario.
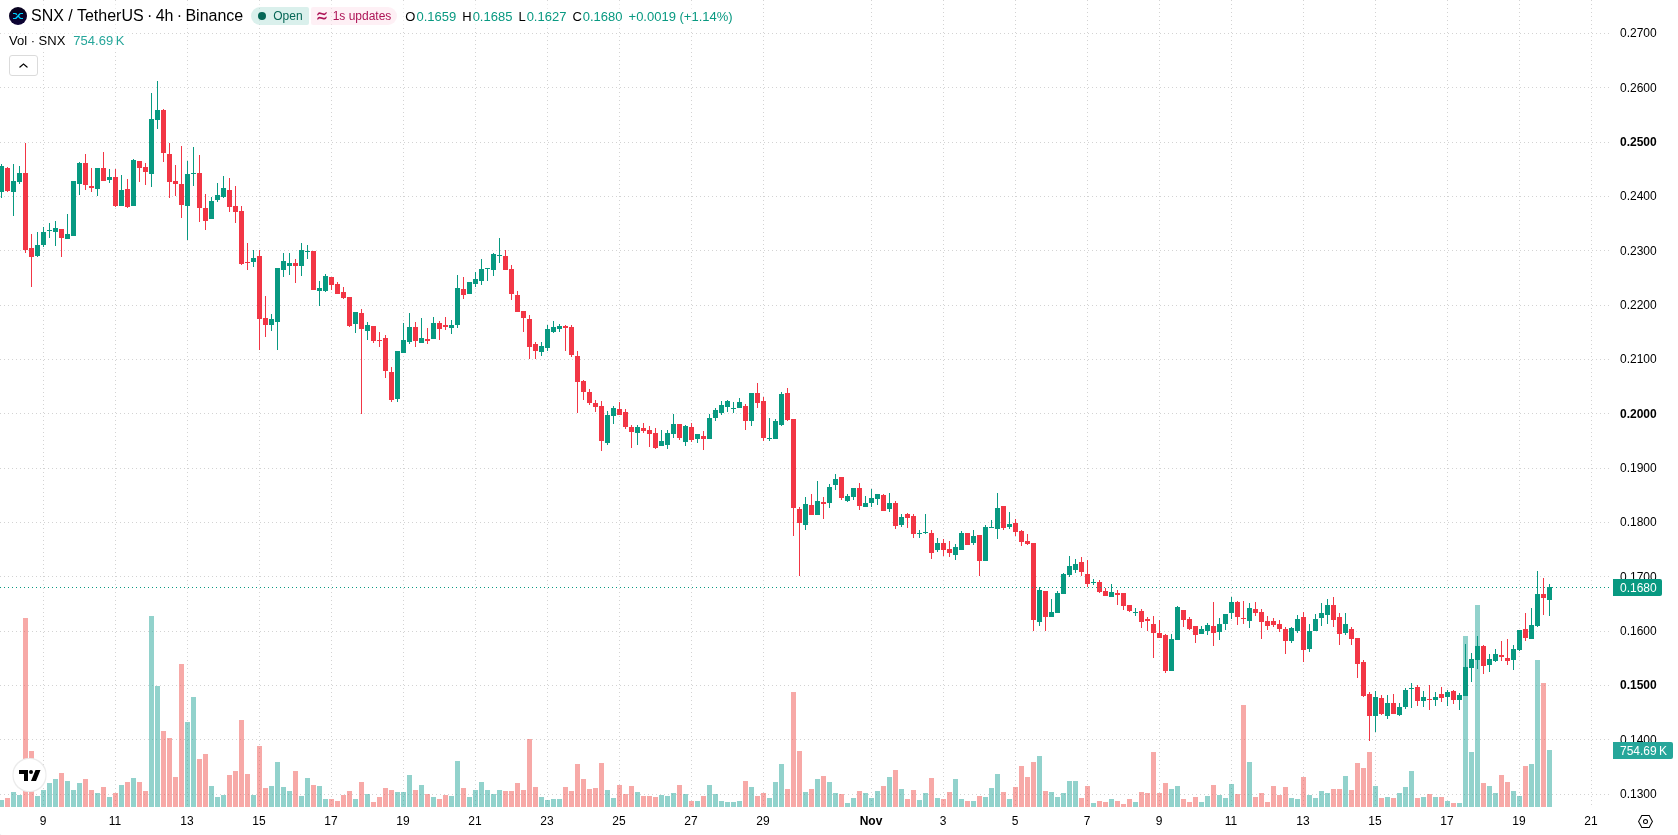
Medium-term sell pressure as resistance holds and momentum weakens
SNX/USD is trading above its 20-day moving average at $0.1654 but remains below both its 50-day at $0.2029 and 200-day at $0.2338 moving averages. This setup highlights ongoing medium- and long-term seller pressure, with the near-term resistance at $0.1709 and support at $0.1662 defining current intraday levels. Momentum indicators are mostly negative, with both the MACD and ADX flagging underlying weakness. The RSI and CCI are neutral, while the Stochastic RSI sits in the overbought zone, suggesting a correction risk. Intraday, the Bull/Bear Power is slightly negative, indicating that sellers still have control, even as the price registers a sharp daily advance to $0.1684 after a significant gap higher and a volatility amplitude of 9.34%. This price action shows strong short-term demand, at odds with prevailing momentum signals.
Earlier, analysts noted that Synthetix was exhibiting strong short-term momentum but cautioned that overbought signals could lead to a near-term pullback. The current setup underscores this risk, with downside momentum prevailing and volatility elevated, making sustained moves above $0.1817 the critical threshold for any shift toward a bullish outlook.






Latest Synthetix News




-
 Afghanistan
-
 Albania
-
 Algeria
-
 Angola
-
 Argentina
-
 Armenia
-
 Australia
-
 Austria
-
 Azerbaijan
-
 Bahamas
-
 Bahrain
-
 Bangladesh
-
 Belarus
-
 Belgium
-
 Bolivia
-
 Botswana
-
 Brazil
-
 Brunei
-
 Bulgaria
-
 Cambodia
-
 Cameroon
-
 Canada
-
 Chile
-
 China
-
 Colombia
-
 Congo
-
 Costa Rica
-
 Cote d'Ivoire
-
 Croatia
-
 Cuba
-
 Cyprus
-
 Czechia
-
 DR Congo
-
 Denmark
-
 Dominican Republic
-
 Ecuador
-
 Egypt
-
 El Salvador
-
 Estonia
-
 Eswatini
-
 Ethiopia
-
 Finland
-
 France
-
 Georgia
-
 Germany
-
 Ghana
-
 Greece
-
 Haiti
-
 Hong Kong
-
 Hungary
-
 India
-
 Indonesia
-
 Iran, Islamic republic
-
 Iraq
-
 Ireland
-
 Israel
-
 Italy
-
 Jamaica
-
 Japan
-
 Jordan
-
 Kazakhstan
-
 Kenya
-
 Korea
-
 Kuwait
-
 Kyrgyzstan
-
 Laos
-
 Latvia
-
 Lebanon
-
 Lesotho
-
 Libya
-
 Lithuania
-
 Luxembourg
-
 Madagascar
-
 Malaysia
-
 Malta
-
 Mauritius
-
 Mexico
-
 Moldova
-
 Mongolia
-
 Montenegro
-
 Morocco
-
 Mozambique
-
 Myanmar
-
 Namibia
-
 Nepal
-
 Netherlands
-
 New Zealand
-
 Nigeria
-
 North Macedonia
-
 Norway
-
 Oman
-
 Pakistan
-
 Palestine
-
 Panama
-
 Papua New Guinea
-
 Paraguay
-
 Peru
-
 Philippines
-
 Poland
-
 Portugal
-
 Puerto Rico
-
 Qatar
-
 Reunion
-
 Romania
-
 Rwanda
-
 Saudi Arabia
-
 Serbia
-
 Singapore
-
 Slovakia
-
 Slovenia
-
 Somalia
-
 South Africa
-
 Spain
-
 Sri Lanka
-
 Sweden
-
 Switzerland
-
 Syria
-
 Taiwan
-
 Tajikistan
-
 Tanzania
-
 Thailand
-
 Trinidad and Tobago
-
 Tunisia
-
 Turkey
-
 UAE
-
 Uganda
-
 Ukraine
-
 United Kingdom
-
United States
-
 Uruguay
-
 Uzbekistan
-
 Venezuela
-
 Vietnam
-
 Yemen
-
 Zambia
-
 Zimbabwe
- Forex
- Crypto












