


Pyth (PYTH) is trading at $0.0513 after falling 8.8% today, with the move positioning the asset below its key moving averages across both the hourly and daily timeframes. The day opened at a gap lower amid high volatility.
 0.0536
0.0649
Highlights
- Pyth Network confirmed its data feed now includes $ANT, expanding the ecosystem and attracting projects seeking reliable token price data.
- $ANT has undergone persistent selling pressure, with no relief in the broader market following the platform's expansion.
- Trade remains decisively bearish as price fell 8.8% to $0.0513, with significant volatility and next 2 to 3 days forecast in the $0.0395 to $0.0543 range.
Network expansion lifts ecosystem use amid persistent sell flows
Pyth Network has confirmed the live launch of a data feed for the $ANT token, according to Cryptonews. This expansion broadens the network's ecosystem by supporting an additional asset, which may increase oracle utilization and attract further engagement from projects seeking reliable price data. Despite this platform enhancement, the asset has faced sustained selling pressure in the broader market.
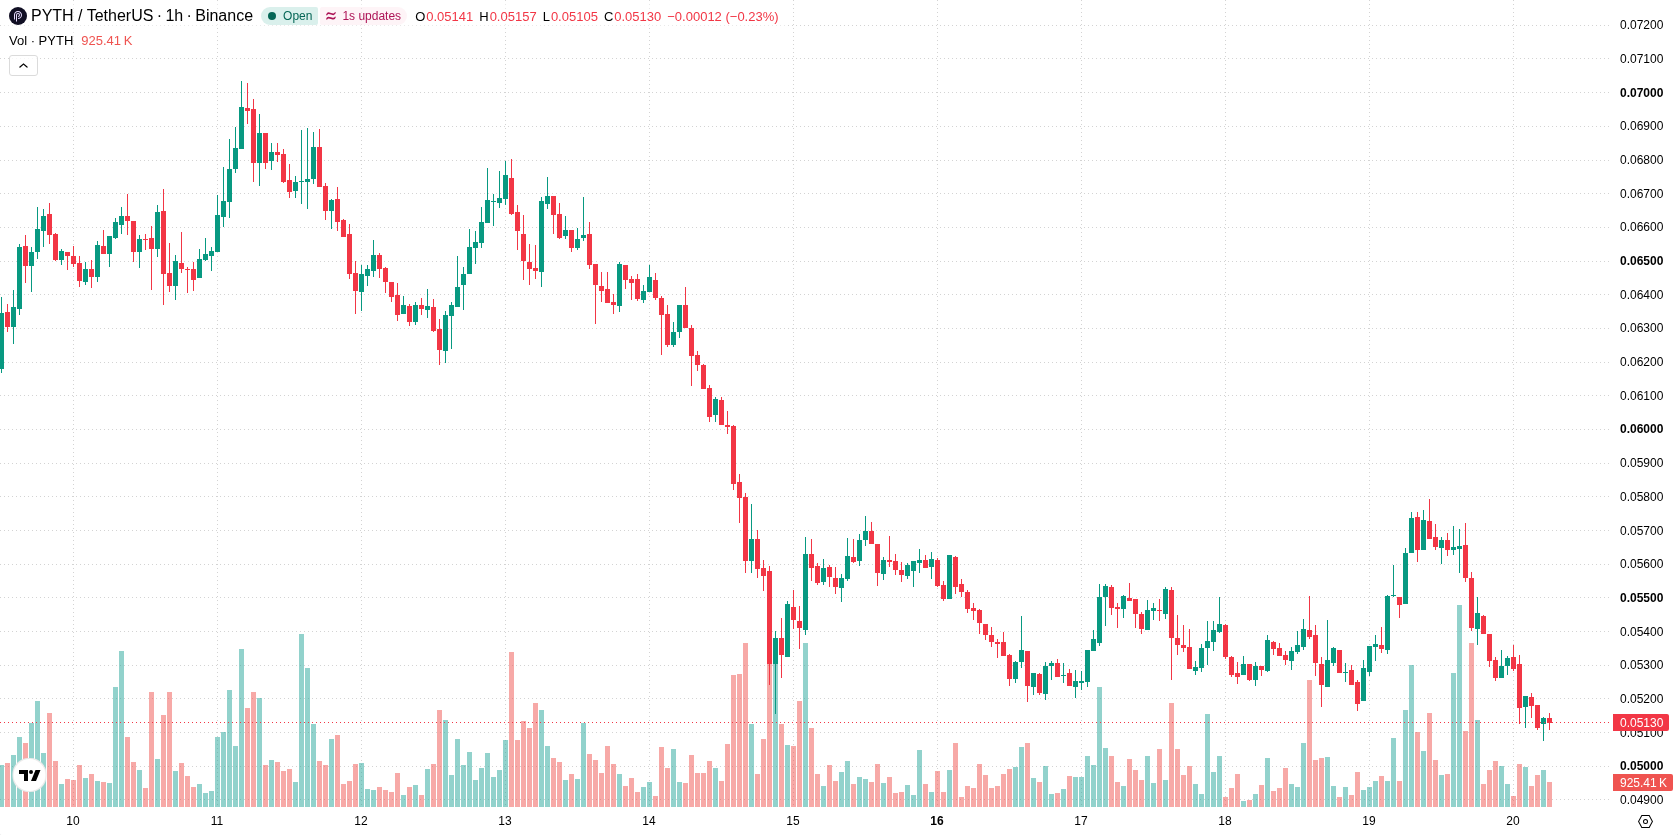
Bearish momentum persists as oversold signals limit rebound odds
On the technical front, PYTH/USD remains below the H1 SMA-20 at $0.054, H1 SMA-50 at $0.0539, and D1 SMA-200 at $0.0524. Immediate resistance is evident at the Ichimoku Kijun level of $0.0545. Momentum indicators point to continued weakness: MACD and ADX signal Sell, Stochastic RSI and CCI have entered oversold territory, while the RSI stays neutral. Bull/Bear Power at –0.0013 reflects intraday seller control, and the Awesome Oscillator confirms the current downside bias. Despite the dominant bearish signals, the combination of oversold CCI and Stochastic RSI suggests short-term selling exhaustion but does not yet indicate a confirmed rebound, resulting in mixed technical signals.
Downside breakout risk elevated as volatility band persists
Over the next 2–3 trading days, the expected price range spans $0.0395 to $0.0543, representing the typical volatility band relative to current levels. The probability of an upward breakout is classified as very low, whereas a further decline has a very high likelihood. If price consolidates, movement would likely occur within the presented corridor. A break above $0.0545 could trigger a recovery rally, while a drop below $0.0395 may accelerate downside momentum.
Earlier, analysts noted a shift to short-term bullish momentum for Pyth as the asset sustained levels above key technical supports. The current selloff marks a reversal of that trend, and with both price and indicators signaling downside risk, traders should monitor the $0.0545 level for any signs of a recovery attempt.






Latest Pyth News





-
 Afghanistan
-
 Albania
-
 Algeria
-
 Angola
-
 Argentina
-
 Armenia
-
 Australia
-
 Austria
-
 Azerbaijan
-
 Bahamas
-
 Bahrain
-
 Bangladesh
-
 Belarus
-
 Belgium
-
 Bolivia
-
 Botswana
-
 Brazil
-
 Brunei
-
 Bulgaria
-
 Cambodia
-
 Cameroon
-
 Canada
-
 Chile
-
 China
-
 Colombia
-
 Congo
-
 Costa Rica
-
 Cote d'Ivoire
-
 Croatia
-
 Cuba
-
 Cyprus
-
 Czechia
-
 DR Congo
-
 Denmark
-
 Dominican Republic
-
 Ecuador
-
 Egypt
-
 El Salvador
-
 Estonia
-
 Eswatini
-
 Ethiopia
-
 Finland
-
 France
-
 Georgia
-
 Germany
-
 Ghana
-
 Greece
-
 Haiti
-
 Hong Kong
-
 Hungary
-
 India
-
 Indonesia
-
 Iran, Islamic republic
-
 Iraq
-
 Ireland
-
 Israel
-
 Italy
-
 Jamaica
-
 Japan
-
 Jordan
-
 Kazakhstan
-
 Kenya
-
 Korea
-
 Kuwait
-
 Kyrgyzstan
-
 Laos
-
 Latvia
-
 Lebanon
-
 Lesotho
-
 Libya
-
 Lithuania
-
 Luxembourg
-
 Madagascar
-
 Malaysia
-
 Malta
-
 Mauritius
-
 Mexico
-
 Moldova
-
 Mongolia
-
 Montenegro
-
 Morocco
-
 Mozambique
-
 Myanmar
-
 Namibia
-
 Nepal
-
 Netherlands
-
 New Zealand
-
 Nigeria
-
 North Macedonia
-
 Norway
-
 Oman
-
 Pakistan
-
 Palestine
-
 Panama
-
 Papua New Guinea
-
 Paraguay
-
 Peru
-
 Philippines
-
 Poland
-
 Portugal
-
 Puerto Rico
-
 Qatar
-
 Reunion
-
 Romania
-
 Rwanda
-
 Saudi Arabia
-
 Serbia
-
 Singapore
-
 Slovakia
-
 Slovenia
-
 Somalia
-
 South Africa
-
 Spain
-
 Sri Lanka
-
 Sweden
-
 Switzerland
-
 Syria
-
 Taiwan
-
 Tajikistan
-
 Tanzania
-
 Thailand
-
 Trinidad and Tobago
-
 Tunisia
-
 Turkey
-
 UAE
-
 Uganda
-
 Ukraine
-
 United Kingdom
-
United States
-
 Uruguay
-
 Uzbekistan
-
 Venezuela
-
 Vietnam
-
 Yemen
-
 Zambia
-
 Zimbabwe
- Forex
- Crypto












