

Sonic technical analysis: Weak momentum and seller dominance cap recovery prospects

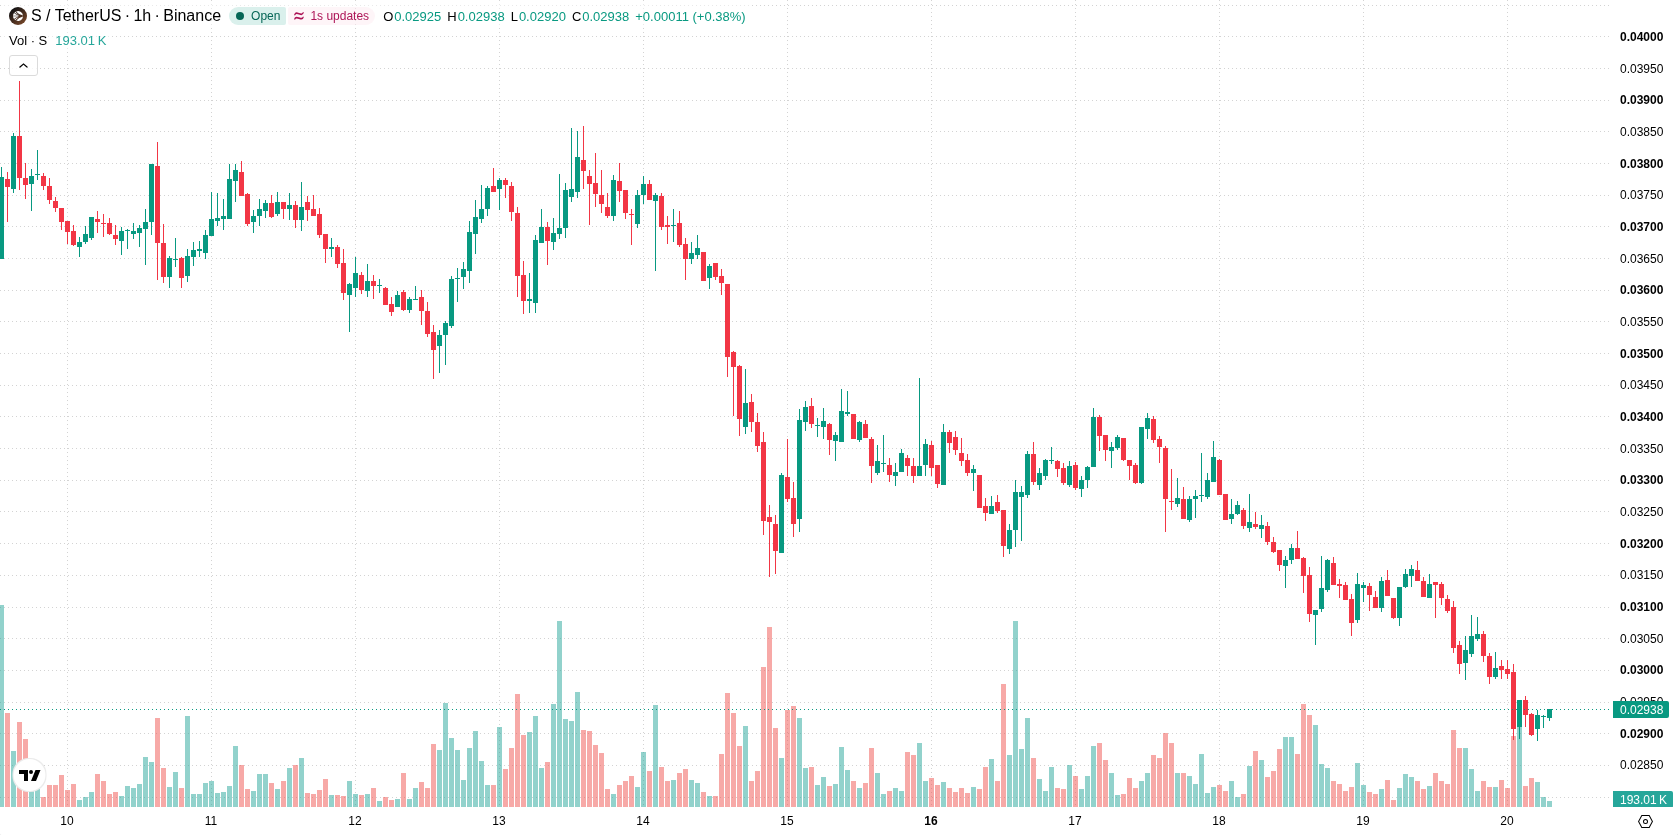
Sonic (S) is trading at $0.0292, marking a daily decline of 7.12%. The price sits below its key moving averages, reflecting persistent selling interest across multiple timeframes.
 0.0274
0.0346
Highlights
- S/USD traded below major moving averages across all timeframes, confirming strong downward momentum in short, medium, and long term.
- MACD and ADX showed clear sell signals, with CCI in the oversold zone and other oscillators mostly neutral, indicating persistent weakness.
- Price dropped 7.12% to $0.0292, with the short-term range expected to hold between $0.0251 and $0.031 and a high likelihood of further downside.
Bearish momentum as price rejected beneath technical barriers
On the H1 chart, S/USD is positioned below H1 SMA-20 at $0.0301 and H1 SMA-50 at $0.0309, as well as below the D1 SMA-200 at $0.0343. The Ichimoku Kijun, currently at $0.0303, acts as immediate resistance. Momentum indicators provide a weak outlook: MACD and ADX show a sell configuration, while RSI and Stochastic RSI remain neutral. CCI is in the oversold zone, indicating potential exhaustion among sellers. Bull/Bear Power is slightly negative, reflecting ongoing intraday seller dominance, and the Awesome Oscillator remains neutral, failing to confirm either direction. Signals from oscillators are mixed, driven primarily by neutral readings.
Limited rebound odds as downside risk dominates outlook
In the next one to two trading days, S/USD is expected to remain within a volatile price band of $0.0251 to $0.031. The probability of an upward move is considered very low, while the likelihood of further downside is high, limiting near-term prospects for a recovery. The base case scenario envisions range-bound action inside these levels. Should price decisively clear the immediate resistance at $0.0303, a bullish scenario could unfold, while a pronounced breakdown below $0.0251 would increase the risk of additional declines.
Earlier, analysts noted that Sonic was facing persistent downside momentum and weaker technical conditions across multiple timeframes. The latest data reinforce this bearish outlook, with traders now closely monitoring the $0.0251 support as a critical level that could accelerate further declines if breached.










-
 Afghanistan
-
 Albania
-
 Algeria
-
 Angola
-
 Argentina
-
 Armenia
-
 Australia
-
 Austria
-
 Azerbaijan
-
 Bahamas
-
 Bahrain
-
 Bangladesh
-
 Belarus
-
 Belgium
-
 Bolivia
-
 Botswana
-
 Brazil
-
 Brunei
-
 Bulgaria
-
 Cambodia
-
 Cameroon
-
 Canada
-
 Chile
-
 China
-
 Colombia
-
 Congo
-
 Costa Rica
-
 Cote d'Ivoire
-
 Croatia
-
 Cuba
-
 Cyprus
-
 Czechia
-
 DR Congo
-
 Denmark
-
 Dominican Republic
-
 Ecuador
-
 Egypt
-
 El Salvador
-
 Estonia
-
 Eswatini
-
 Ethiopia
-
 Finland
-
 France
-
 Georgia
-
 Germany
-
 Ghana
-
 Greece
-
 Haiti
-
 Hong Kong
-
 Hungary
-
 India
-
 Indonesia
-
 Iran, Islamic republic
-
 Iraq
-
 Ireland
-
 Israel
-
 Italy
-
 Jamaica
-
 Japan
-
 Jordan
-
 Kazakhstan
-
 Kenya
-
 Korea
-
 Kuwait
-
 Kyrgyzstan
-
 Laos
-
 Latvia
-
 Lebanon
-
 Lesotho
-
 Libya
-
 Lithuania
-
 Luxembourg
-
 Madagascar
-
 Malaysia
-
 Malta
-
 Mauritius
-
 Mexico
-
 Moldova
-
 Mongolia
-
 Montenegro
-
 Morocco
-
 Mozambique
-
 Myanmar
-
 Namibia
-
 Nepal
-
 Netherlands
-
 New Zealand
-
 Nigeria
-
 North Macedonia
-
 Norway
-
 Oman
-
 Pakistan
-
 Palestine
-
 Panama
-
 Papua New Guinea
-
 Paraguay
-
 Peru
-
 Philippines
-
 Poland
-
 Portugal
-
 Puerto Rico
-
 Qatar
-
 Reunion
-
 Romania
-
 Rwanda
-
 Saudi Arabia
-
 Serbia
-
 Singapore
-
 Slovakia
-
 Slovenia
-
 Somalia
-
 South Africa
-
 Spain
-
 Sri Lanka
-
 Sweden
-
 Switzerland
-
 Syria
-
 Taiwan
-
 Tajikistan
-
 Tanzania
-
 Thailand
-
 Trinidad and Tobago
-
 Tunisia
-
 Turkey
-
 UAE
-
 Uganda
-
 Ukraine
-
 United Kingdom
-
United States
-
 Uruguay
-
 Uzbekistan
-
 Venezuela
-
 Vietnam
-
 Yemen
-
 Zambia
-
 Zimbabwe
- Forex
- Crypto












