

Sonic drops more than 10% after break below all key moving averages and strong bearish momentum

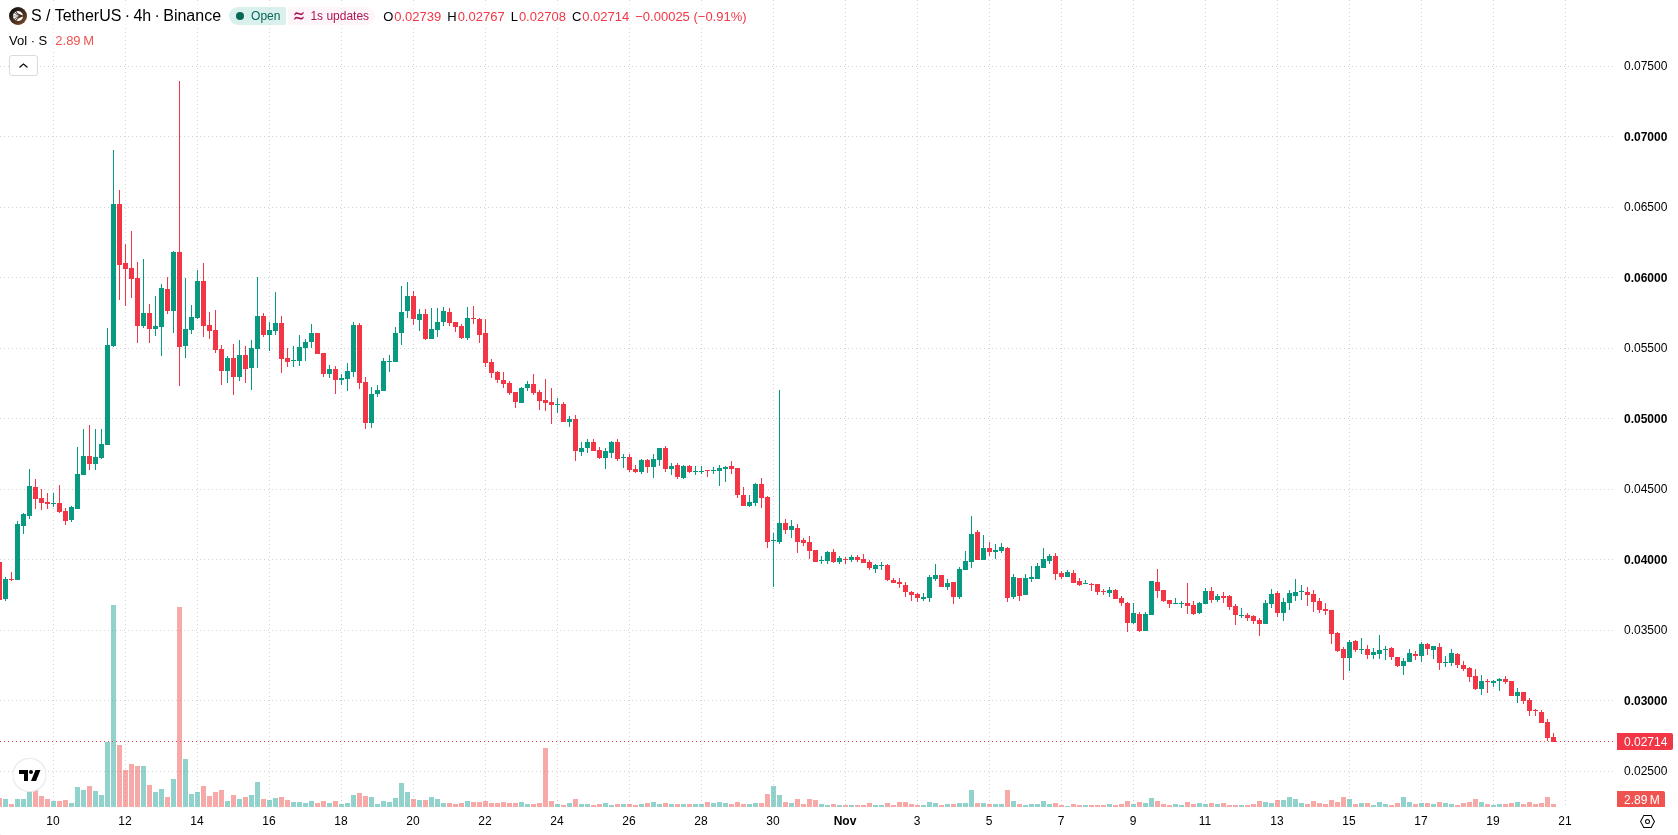
Sonic (S, formerly Fantom) slumped 10.13% as heavy technical selling pressure drove sharp intraday losses. The pronounced downside is reinforced by a break below all key moving averages and clear bearish momentum signals.
 0.0302
0.0378
Highlights
- S/USD trades below all major moving averages, confirming downside pressure across short-, medium-, and long-term horizons.
- Momentum indicators show a decisive sell bias with oversold oscillator readings and intraday volatility at 7.86%.
- The expected five-session range is $0.0215 to $0.0312, with an over 80% probability of further downside movement.
Bearish bias intensifies as price remains below key averages
S/USD remains below all major moving averages, with the current price at $0.0272 under the MA-20 ($0.0363), MA-50 ($0.0437), and MA-200 ($0.0343). This configuration signals consistent downward momentum across timeframes, with resistance at $0.028 and support at $0.0215. Although the MA-50 versus MA-200 relationship suggests the long-term trend could eventually turn bullish, current price action indicates continued downside risk. Bearish momentum dominates, as signaled by MACD and Awesome Oscillator with a sell bias, and the ADX indicates weak trend strength at 18.76. The RSI is neutral, while both the Stochastic RSI and Commodity Channel Index (CCI) remain in oversold zones. Negative Bull/Bear Power (BBP) underscores seller dominance in intraday action. The pair trades near the session low after a clear downside gap at the open, with elevated volatility at 7.86%. All oscillator extremes and momentum readings indicate strong downside control at this stage, despite a neutral RSI.
Earlier, analysts noted that Sonic was exhibiting persistent bearish momentum and continued technical weakness. Latest price action and indicator readings reinforce this negative outlook, making the $0.0215 threshold a critical downside level for traders to monitor in the sessions ahead.










-
 Afghanistan
-
 Albania
-
 Algeria
-
 Angola
-
 Argentina
-
 Armenia
-
 Australia
-
 Austria
-
 Azerbaijan
-
 Bahamas
-
 Bahrain
-
 Bangladesh
-
 Belarus
-
 Belgium
-
 Bolivia
-
 Botswana
-
 Brazil
-
 Brunei
-
 Bulgaria
-
 Cambodia
-
 Cameroon
-
 Canada
-
 Chile
-
 China
-
 Colombia
-
 Congo
-
 Costa Rica
-
 Cote d'Ivoire
-
 Croatia
-
 Cuba
-
 Cyprus
-
 Czechia
-
 DR Congo
-
 Denmark
-
 Dominican Republic
-
 Ecuador
-
 Egypt
-
 El Salvador
-
 Estonia
-
 Eswatini
-
 Ethiopia
-
 Finland
-
 France
-
 Georgia
-
 Germany
-
 Ghana
-
 Greece
-
 Haiti
-
 Hong Kong
-
 Hungary
-
 India
-
 Indonesia
-
 Iran, Islamic republic
-
 Iraq
-
 Ireland
-
 Israel
-
 Italy
-
 Jamaica
-
 Japan
-
 Jordan
-
 Kazakhstan
-
 Kenya
-
 Korea
-
 Kuwait
-
 Kyrgyzstan
-
 Laos
-
 Latvia
-
 Lebanon
-
 Lesotho
-
 Libya
-
 Lithuania
-
 Luxembourg
-
 Madagascar
-
 Malaysia
-
 Malta
-
 Mauritius
-
 Mexico
-
 Moldova
-
 Mongolia
-
 Montenegro
-
 Morocco
-
 Mozambique
-
 Myanmar
-
 Namibia
-
 Nepal
-
 Netherlands
-
 New Zealand
-
 Nigeria
-
 North Macedonia
-
 Norway
-
 Oman
-
 Pakistan
-
 Palestine
-
 Panama
-
 Papua New Guinea
-
 Paraguay
-
 Peru
-
 Philippines
-
 Poland
-
 Portugal
-
 Puerto Rico
-
 Qatar
-
 Reunion
-
 Romania
-
 Rwanda
-
 Saudi Arabia
-
 Serbia
-
 Singapore
-
 Slovakia
-
 Slovenia
-
 Somalia
-
 South Africa
-
 Spain
-
 Sri Lanka
-
 Sweden
-
 Switzerland
-
 Syria
-
 Taiwan
-
 Tajikistan
-
 Tanzania
-
 Thailand
-
 Trinidad and Tobago
-
 Tunisia
-
 Turkey
-
 UAE
-
 Uganda
-
 Ukraine
-
 United Kingdom
-
United States
-
 Uruguay
-
 Uzbekistan
-
 Venezuela
-
 Vietnam
-
 Yemen
-
 Zambia
-
 Zimbabwe
- Forex
- Crypto












