

Jupiter technical analysis: Weak momentum as price holds above $0.2116 support

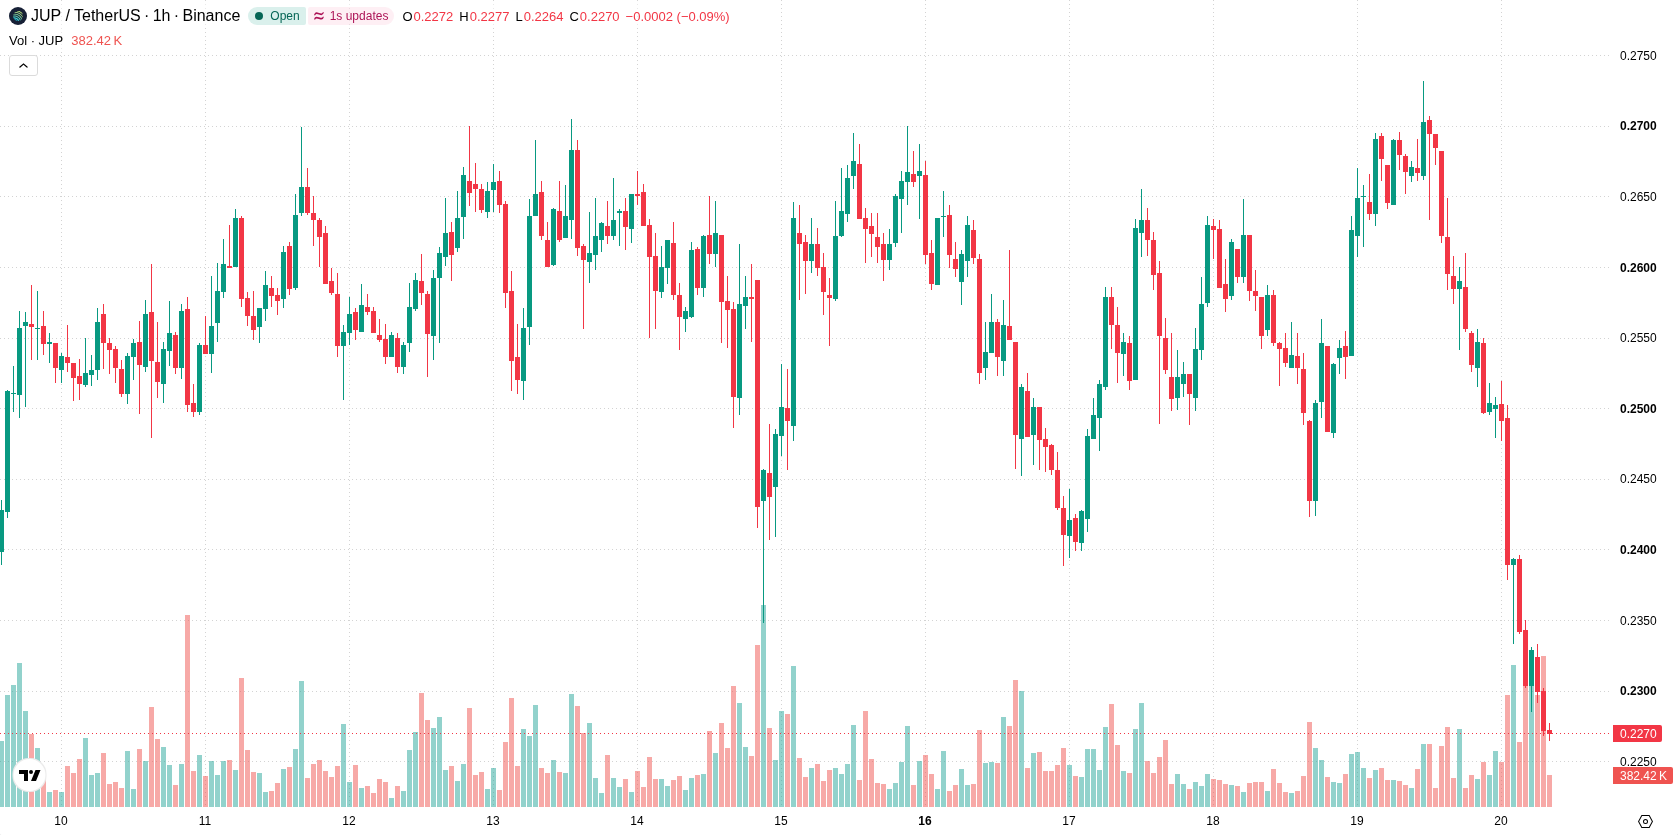
Jupiter (JUP) is trading at $0.2275, marking a daily decline of 14.73%. The token remains below its key short- and long-term moving averages, indicating continued bearish momentum in the current session.
 0.2519
0.2732
Highlights
- Ledger implemented Clear Signing on Solana with Jupiter, reducing Jupiter swap approval steps from 13 to 3 and confirming 57,000 real transactions.
- This technical upgrade improves end-user efficiency and strengthens Jupiter's ecosystem utility, but has not offset prevailing market selling pressure.
- Jupiter trades with strong bearish momentum below key moving averages, with a projected 1-day price range of $0.2116 to $0.2361 and high downside probability.
Operational efficiency rises for Jupiter as market selling tempers impact
Ledger's implementation of Clear Signing functionality on Solana, with Jupiter as the initial partner, has significantly streamlined the approval process for Jupiter swaps by reducing the number of steps from 13 screens to just three, according to Cfotech. This rollout, confirmed by approximately 57,000 real transactions, enhances operational efficiency for end-users and signals a notable technical advancement for the Jupiter ecosystem. While this integration positions Jupiter for improved long-term engagement and utility, the overall effect has been muted in the face of current broad-based market selling pressure.
Persistent technical weakness as oversold signals suggest limited rebound
On the technical front, JUP is trading below the H1 SMA-20 at $0.2487, the H1 SMA-50 at $0.2549, and the D1 SMA-200 at $0.2325, highlighting continued weakness across key timeframes. The immediate resistance is located at the Ichimoku Kijun level of $0.2505. Both MACD and ADX remain firmly on sell signals. RSI, Stoch RSI, and CCI are deep in oversold territory, which suggests the possibility of a near-term rebound but does not confirm a reversal. Intraday momentum continues to favor sellers, as shown by Bull/Bear Power at -0.0099 and sustained negative readings from the Awesome Oscillator.
Price consolidation likely as downside risk outweighs upside potential
Looking ahead to the next trading day, the expected price range for JUP is $0.2116 to $0.2361, reflecting a volatility band relative to current levels. The probability of continued downside remains very high, while the likelihood of a significant upward move is very low. Base case expectations favor price consolidation within this corridor, with any bullish scenario requiring a break above the $0.2505 resistance, and further declines likely on a break below $0.2116.
Earlier, analysts noted that Jupiter was experiencing persistent technical weakness and elevated downside risk despite ongoing protocol developments. The latest session’s sharper decline reinforces this bearish backdrop, and with indicators remaining negative, traders should closely monitor the $0.2116 support as a critical threshold for further downside.










-
 Afghanistan
-
 Albania
-
 Algeria
-
 Angola
-
 Argentina
-
 Armenia
-
 Australia
-
 Austria
-
 Azerbaijan
-
 Bahamas
-
 Bahrain
-
 Bangladesh
-
 Belarus
-
 Belgium
-
 Bolivia
-
 Botswana
-
 Brazil
-
 Brunei
-
 Bulgaria
-
 Cambodia
-
 Cameroon
-
 Canada
-
 Chile
-
 China
-
 Colombia
-
 Congo
-
 Costa Rica
-
 Cote d'Ivoire
-
 Croatia
-
 Cuba
-
 Cyprus
-
 Czechia
-
 DR Congo
-
 Denmark
-
 Dominican Republic
-
 Ecuador
-
 Egypt
-
 El Salvador
-
 Estonia
-
 Eswatini
-
 Ethiopia
-
 Finland
-
 France
-
 Georgia
-
 Germany
-
 Ghana
-
 Greece
-
 Haiti
-
 Hong Kong
-
 Hungary
-
 India
-
 Indonesia
-
 Iran, Islamic republic
-
 Iraq
-
 Ireland
-
 Israel
-
 Italy
-
 Jamaica
-
 Japan
-
 Jordan
-
 Kazakhstan
-
 Kenya
-
 Korea
-
 Kuwait
-
 Kyrgyzstan
-
 Laos
-
 Latvia
-
 Lebanon
-
 Lesotho
-
 Libya
-
 Lithuania
-
 Luxembourg
-
 Madagascar
-
 Malaysia
-
 Malta
-
 Mauritius
-
 Mexico
-
 Moldova
-
 Mongolia
-
 Montenegro
-
 Morocco
-
 Mozambique
-
 Myanmar
-
 Namibia
-
 Nepal
-
 Netherlands
-
 New Zealand
-
 Nigeria
-
 North Macedonia
-
 Norway
-
 Oman
-
 Pakistan
-
 Palestine
-
 Panama
-
 Papua New Guinea
-
 Paraguay
-
 Peru
-
 Philippines
-
 Poland
-
 Portugal
-
 Puerto Rico
-
 Qatar
-
 Reunion
-
 Romania
-
 Rwanda
-
 Saudi Arabia
-
 Serbia
-
 Singapore
-
 Slovakia
-
 Slovenia
-
 Somalia
-
 South Africa
-
 Spain
-
 Sri Lanka
-
 Sweden
-
 Switzerland
-
 Syria
-
 Taiwan
-
 Tajikistan
-
 Tanzania
-
 Thailand
-
 Trinidad and Tobago
-
 Tunisia
-
 Turkey
-
 UAE
-
 Uganda
-
 Ukraine
-
 United Kingdom
-
United States
-
 Uruguay
-
 Uzbekistan
-
 Venezuela
-
 Vietnam
-
 Yemen
-
 Zambia
-
 Zimbabwe
- Forex
- Crypto












