

Bonk price outlook: Bearish signals dominate as selling pressure persists

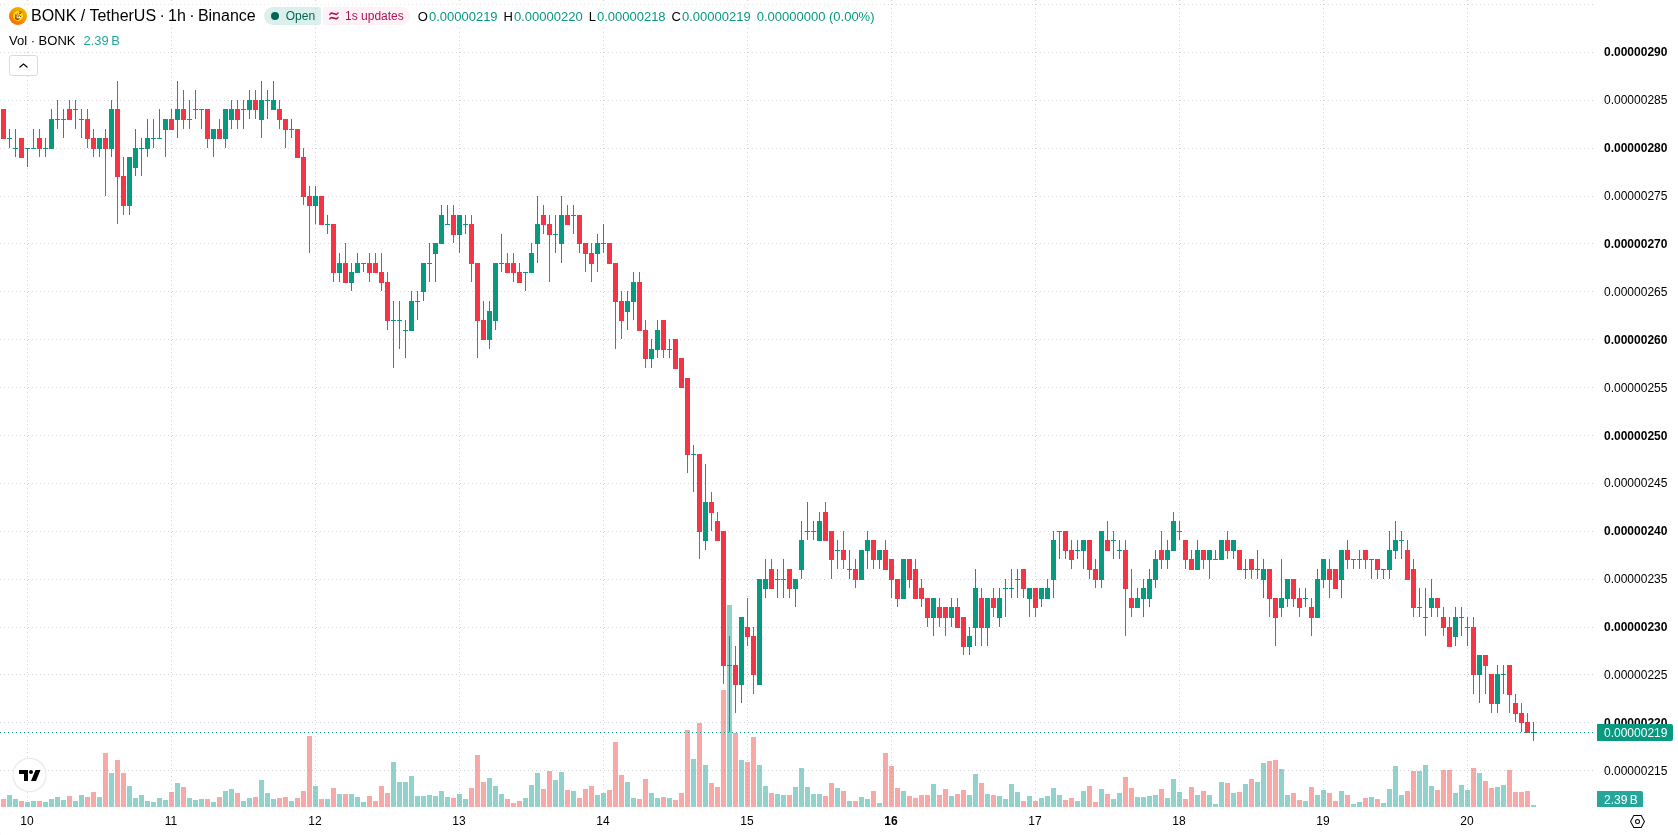
Bonk (BONK) is trading at $0.0000022, down 7.2% for the day. The asset remains below its key moving averages, showing persistent near-term weakness amid elevated volatility.
 0.0523
0.05272
Highlights
- BONK/USD trades below key moving averages across all timeframes, confirming persistent bearish momentum and negative price structure.
- Momentum and trend indicators show consistent sell signals, with no current signs of extreme overbought or oversold conditions.
- Price fell 7.2% to $0.0000022 with high volatility, and the expected 2 to 3 day range is $0.00000181 to $0.00000232 with only a 21% probability of an upward move.
Sell momentum builds as technical ceilings cap recovery attempts
BONK/USD is currently trading below the H1 SMA-20 at $0.00000227, H1 SMA-50 at $0.00000232, and the D1 SMA-200 at $0.00000377. The Ichimoku Kijun on the hourly timeframe stands at $0.0000023, which acts as immediate resistance. Momentum indicators present a bearish bias, with both MACD and ADX signaling sell conditions. All three oscillators — RSI, Stoch RSI, and CCI — are in their neutral zones, indicating neither overbought nor oversold conditions. Bull/Bear Power remains negative, reflecting continued intraday selling, and the Awesome Oscillator also points to further downside.
Downside risk dominates as breakout probability remains subdued
Over the next 2 to 3 trading days, the expected price range for BONK/USD is between $0.00000181 and $0.00000232, reflecting the typical volatility band relative to current levels. The probability of an upward move is estimated at 21%, while a downward move is much more likely at 79%. If the price consolidates within this range, stability may prevail in the short term. A breakout above resistance at $0.0000023 could trigger a corrective move higher, while a breakdown below $0.00000181 would likely accelerate additional selling pressure.
Earlier, analysts noted that Bonk was exhibiting persistent bearish momentum, with technical indicators highlighting continued downside risk. The current analysis reinforces this view, indicating that traders should remain alert to potential volatility and monitor $0.00000181 as a critical support level in the days ahead.










-
 Afghanistan
-
 Albania
-
 Algeria
-
 Angola
-
 Argentina
-
 Armenia
-
 Australia
-
 Austria
-
 Azerbaijan
-
 Bahamas
-
 Bahrain
-
 Bangladesh
-
 Belarus
-
 Belgium
-
 Bolivia
-
 Botswana
-
 Brazil
-
 Brunei
-
 Bulgaria
-
 Cambodia
-
 Cameroon
-
 Canada
-
 Chile
-
 China
-
 Colombia
-
 Congo
-
 Costa Rica
-
 Cote d'Ivoire
-
 Croatia
-
 Cuba
-
 Cyprus
-
 Czechia
-
 DR Congo
-
 Denmark
-
 Dominican Republic
-
 Ecuador
-
 Egypt
-
 El Salvador
-
 Estonia
-
 Eswatini
-
 Ethiopia
-
 Finland
-
 France
-
 Georgia
-
 Germany
-
 Ghana
-
 Greece
-
 Haiti
-
 Hong Kong
-
 Hungary
-
 India
-
 Indonesia
-
 Iran, Islamic republic
-
 Iraq
-
 Ireland
-
 Israel
-
 Italy
-
 Jamaica
-
 Japan
-
 Jordan
-
 Kazakhstan
-
 Kenya
-
 Korea
-
 Kuwait
-
 Kyrgyzstan
-
 Laos
-
 Latvia
-
 Lebanon
-
 Lesotho
-
 Libya
-
 Lithuania
-
 Luxembourg
-
 Madagascar
-
 Malaysia
-
 Malta
-
 Mauritius
-
 Mexico
-
 Moldova
-
 Mongolia
-
 Montenegro
-
 Morocco
-
 Mozambique
-
 Myanmar
-
 Namibia
-
 Nepal
-
 Netherlands
-
 New Zealand
-
 Nigeria
-
 North Macedonia
-
 Norway
-
 Oman
-
 Pakistan
-
 Palestine
-
 Panama
-
 Papua New Guinea
-
 Paraguay
-
 Peru
-
 Philippines
-
 Poland
-
 Portugal
-
 Puerto Rico
-
 Qatar
-
 Reunion
-
 Romania
-
 Rwanda
-
 Saudi Arabia
-
 Serbia
-
 Singapore
-
 Slovakia
-
 Slovenia
-
 Somalia
-
 South Africa
-
 Spain
-
 Sri Lanka
-
 Sweden
-
 Switzerland
-
 Syria
-
 Taiwan
-
 Tajikistan
-
 Tanzania
-
 Thailand
-
 Trinidad and Tobago
-
 Tunisia
-
 Turkey
-
 UAE
-
 Uganda
-
 Ukraine
-
 United Kingdom
-
United States
-
 Uruguay
-
 Uzbekistan
-
 Venezuela
-
 Vietnam
-
 Yemen
-
 Zambia
-
 Zimbabwe
- Forex
- Crypto












