


Fetch.ai (FET) fell 10.36% on continued heavy selling pressure and sustained negative momentum across all technical time frames. Bearish trends are reinforced by the price remaining below its 20-day, 50-day, and 200-day moving averages, confirming further downside risk.
 0.126
0.1492
Highlights
- FET/USD remains locked in a bearish trend, trading below short-, medium-, and long-term moving averages.
- Technical indicators show dominant seller strength, with negative momentum and oversold conditions signaling possible exhaustion.
- Price faces resistance at $0.1206 and support at $0.1003, with a forecast range of $0.1003 to $0.1292 over the next five days.
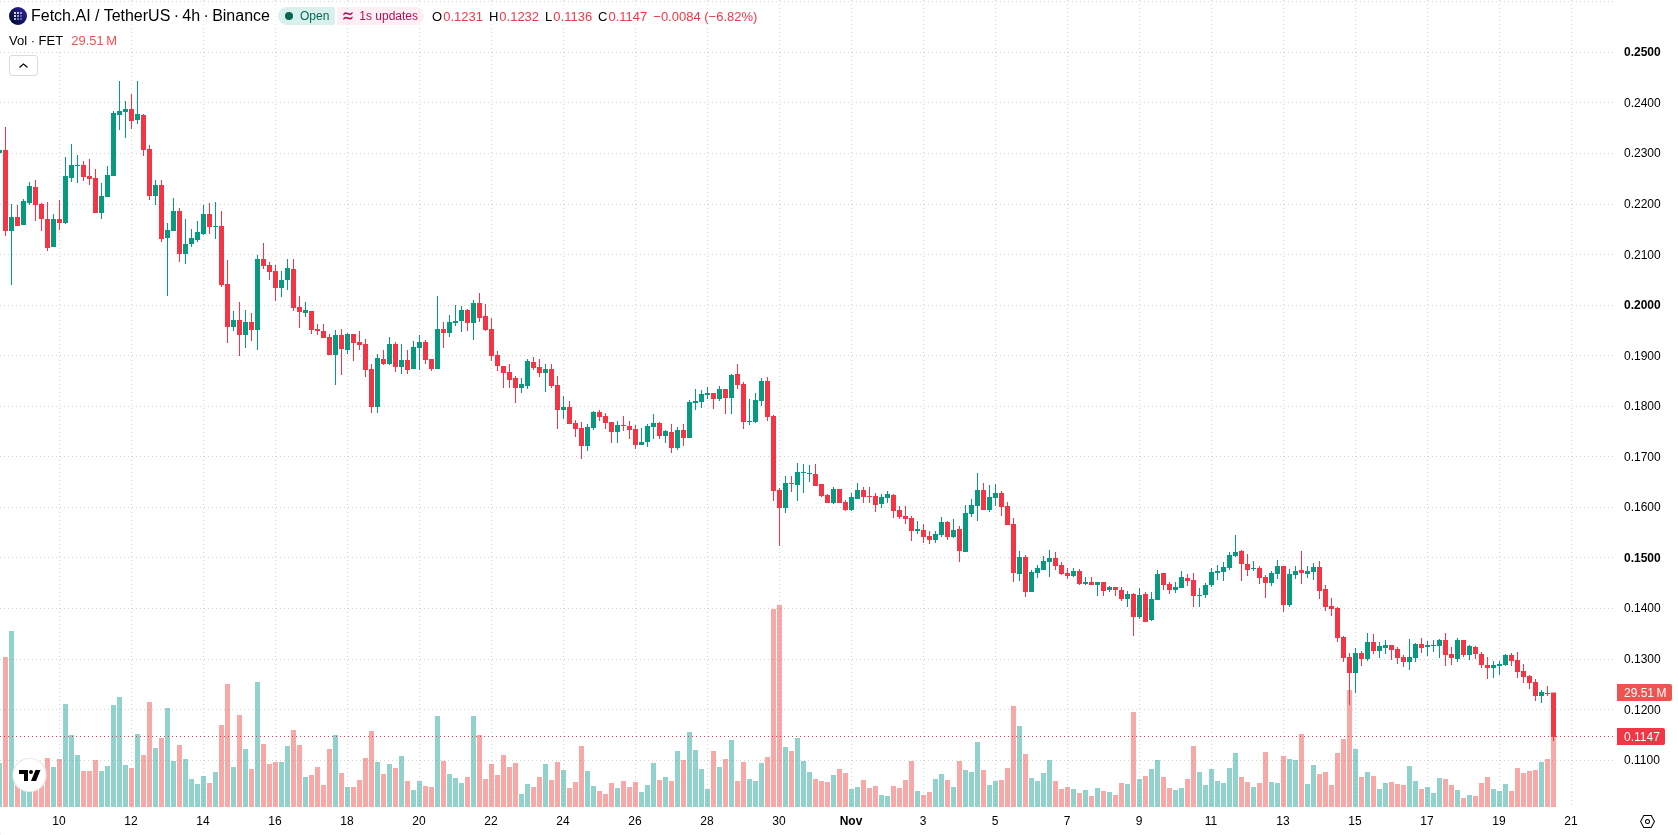
Persistent bearish control as all time frames show downside momentum
FET/USD remains under pressure, with the price at $0.1151, below its 20-day ($0.1442), 50-day ($0.1803), and 200-day ($0.1807) moving averages. This alignment points to ongoing short-, medium-, and long-term bearish trends, with the 50-day versus 200-day setup further confirming a sustained downside bias. The nearest resistance is at $0.1206, and support stands at $0.1003. Intraday momentum is firmly negative, as both the MACD and Average Directional Index (ADX) indicate strong seller strength. The Relative Strength Index (RSI) and Stochastic RSI are both neutral, while the Commodity Channel Index (CCI) is in oversold territory, suggesting potential selling exhaustion. Sellers dominate intraday momentum, as shown by the negative Bull/Bear Power value. Price action shows heavy, uninterrupted selling and no sustained intraday recoveries, confirming the strong bearish momentum.
Previously it was reported that Fetch.ai remained under persistent bearish pressure, with technical indicators signaling continued downside risk. The latest price action and overwhelmingly negative momentum strengthen this view, making a close watch on the $0.1003 support level crucial for assessing the likelihood of further declines.










-
 Afghanistan
-
 Albania
-
 Algeria
-
 Angola
-
 Argentina
-
 Armenia
-
 Australia
-
 Austria
-
 Azerbaijan
-
 Bahamas
-
 Bahrain
-
 Bangladesh
-
 Belarus
-
 Belgium
-
 Bolivia
-
 Botswana
-
 Brazil
-
 Brunei
-
 Bulgaria
-
 Cambodia
-
 Cameroon
-
 Canada
-
 Chile
-
 China
-
 Colombia
-
 Congo
-
 Costa Rica
-
 Cote d'Ivoire
-
 Croatia
-
 Cuba
-
 Cyprus
-
 Czechia
-
 DR Congo
-
 Denmark
-
 Dominican Republic
-
 Ecuador
-
 Egypt
-
 El Salvador
-
 Estonia
-
 Eswatini
-
 Ethiopia
-
 Finland
-
 France
-
 Georgia
-
 Germany
-
 Ghana
-
 Greece
-
 Haiti
-
 Hong Kong
-
 Hungary
-
 India
-
 Indonesia
-
 Iran, Islamic republic
-
 Iraq
-
 Ireland
-
 Israel
-
 Italy
-
 Jamaica
-
 Japan
-
 Jordan
-
 Kazakhstan
-
 Kenya
-
 Korea
-
 Kuwait
-
 Kyrgyzstan
-
 Laos
-
 Latvia
-
 Lebanon
-
 Lesotho
-
 Libya
-
 Lithuania
-
 Luxembourg
-
 Madagascar
-
 Malaysia
-
 Malta
-
 Mauritius
-
 Mexico
-
 Moldova
-
 Mongolia
-
 Montenegro
-
 Morocco
-
 Mozambique
-
 Myanmar
-
 Namibia
-
 Nepal
-
 Netherlands
-
 New Zealand
-
 Nigeria
-
 North Macedonia
-
 Norway
-
 Oman
-
 Pakistan
-
 Palestine
-
 Panama
-
 Papua New Guinea
-
 Paraguay
-
 Peru
-
 Philippines
-
 Poland
-
 Portugal
-
 Puerto Rico
-
 Qatar
-
 Reunion
-
 Romania
-
 Rwanda
-
 Saudi Arabia
-
 Serbia
-
 Singapore
-
 Slovakia
-
 Slovenia
-
 Somalia
-
 South Africa
-
 Spain
-
 Sri Lanka
-
 Sweden
-
 Switzerland
-
 Syria
-
 Taiwan
-
 Tajikistan
-
 Tanzania
-
 Thailand
-
 Trinidad and Tobago
-
 Tunisia
-
 Turkey
-
 UAE
-
 Uganda
-
 Ukraine
-
 United Kingdom
-
United States
-
 Uruguay
-
 Uzbekistan
-
 Venezuela
-
 Vietnam
-
 Yemen
-
 Zambia
-
 Zimbabwe
- Forex
- Crypto












