

Fetch.ai drops over 11% after sustained negative technical momentum and pressure from sellers

Fetch.ai (FET) dropped 11.37% today as sustained negative technical momentum and dominance by sellers remain the core drivers. The move is supported by persistent downward pressure, with the asset trading below all major moving averages and below immediate resistance.
 0.1143
0.1351
Highlights
- FET/USD trades below all key moving averages, reflecting persistent short-, medium-, and long-term downward pressure.
- Technical indicators such as MACD, ADX, RSI, Stochastic RSI, and CCI all confirm weak momentum and oversold conditions.
- FET/USD last traded at $0.1091, with the next five-day expected range at $0.0952 to $0.1206 and high likelihood of continued downside.
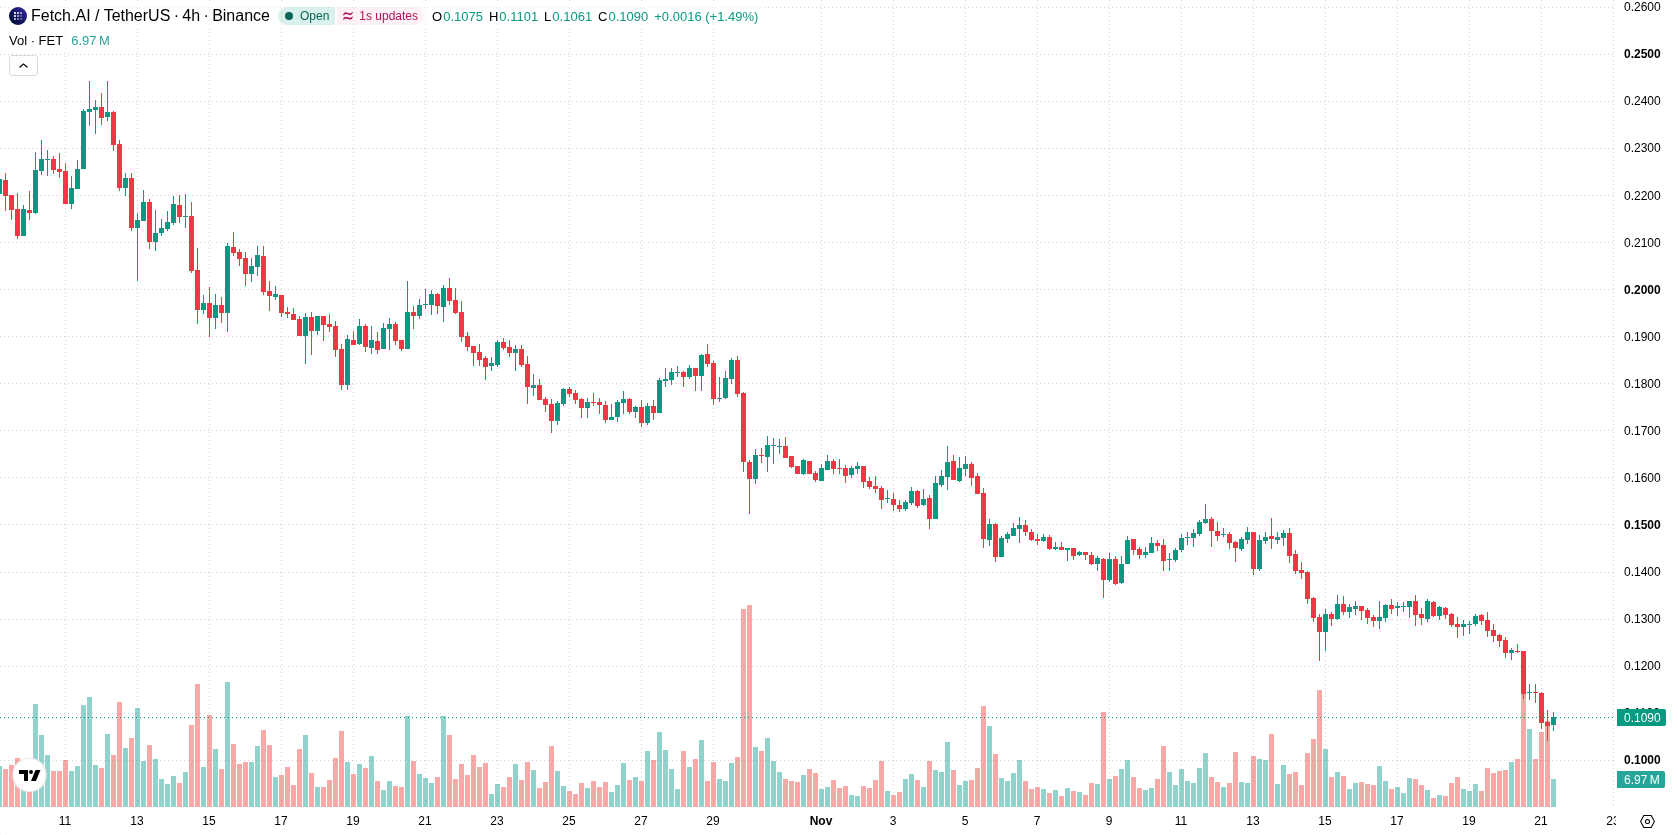
Bearish structure confirmed as FET trades below all technical thresholds
FET/USD is trading below the 20-day moving average ($0.1419), 50-day moving average ($0.178), and 200-day moving average ($0.1803), confirming a bearish picture across short-, medium-, and long-term horizons. The nearest resistance stands at $0.1121, with immediate support at $0.1039, and the alignment of the 50-day and 200-day averages points to a strong bearish bias. Momentum remains weak, as both the MACD and Average Directional Index (ADX) indicate ongoing selling pressure. Oscillators including the Relative Strength Index (RSI), Stochastic RSI, and Commodity Channel Index (CCI) are in their respective oversold zones, which may suggest some potential for selling exhaustion, but this does not guarantee an immediate reversal. Intraday activity is dominated by sellers, as highlighted by negative Bull/Bear Power (BBP), with volatility for the day at 10.01%.
Previously it was reported that Fetch.ai remained under heavy bearish pressure, with technical indicators signaling continued downside risk. The latest price decline and oversold readings reinforce this negative outlook, making the $0.0952 support level a critical threshold for assessing the possibility of further losses in the near term.










-
 Afghanistan
-
 Albania
-
 Algeria
-
 Angola
-
 Argentina
-
 Armenia
-
 Australia
-
 Austria
-
 Azerbaijan
-
 Bahamas
-
 Bahrain
-
 Bangladesh
-
 Belarus
-
 Belgium
-
 Bolivia
-
 Botswana
-
 Brazil
-
 Brunei
-
 Bulgaria
-
 Cambodia
-
 Cameroon
-
 Canada
-
 Chile
-
 China
-
 Colombia
-
 Congo
-
 Costa Rica
-
 Cote d'Ivoire
-
 Croatia
-
 Cuba
-
 Cyprus
-
 Czechia
-
 DR Congo
-
 Denmark
-
 Dominican Republic
-
 Ecuador
-
 Egypt
-
 El Salvador
-
 Estonia
-
 Eswatini
-
 Ethiopia
-
 Finland
-
 France
-
 Georgia
-
 Germany
-
 Ghana
-
 Greece
-
 Haiti
-
 Hong Kong
-
 Hungary
-
 India
-
 Indonesia
-
 Iran, Islamic republic
-
 Iraq
-
 Ireland
-
 Israel
-
 Italy
-
 Jamaica
-
 Japan
-
 Jordan
-
 Kazakhstan
-
 Kenya
-
 Korea
-
 Kuwait
-
 Kyrgyzstan
-
 Laos
-
 Latvia
-
 Lebanon
-
 Lesotho
-
 Libya
-
 Lithuania
-
 Luxembourg
-
 Madagascar
-
 Malaysia
-
 Malta
-
 Mauritius
-
 Mexico
-
 Moldova
-
 Mongolia
-
 Montenegro
-
 Morocco
-
 Mozambique
-
 Myanmar
-
 Namibia
-
 Nepal
-
 Netherlands
-
 New Zealand
-
 Nigeria
-
 North Macedonia
-
 Norway
-
 Oman
-
 Pakistan
-
 Palestine
-
 Panama
-
 Papua New Guinea
-
 Paraguay
-
 Peru
-
 Philippines
-
 Poland
-
 Portugal
-
 Puerto Rico
-
 Qatar
-
 Reunion
-
 Romania
-
 Rwanda
-
 Saudi Arabia
-
 Serbia
-
 Singapore
-
 Slovakia
-
 Slovenia
-
 Somalia
-
 South Africa
-
 Spain
-
 Sri Lanka
-
 Sweden
-
 Switzerland
-
 Syria
-
 Taiwan
-
 Tajikistan
-
 Tanzania
-
 Thailand
-
 Trinidad and Tobago
-
 Tunisia
-
 Turkey
-
 UAE
-
 Uganda
-
 Ukraine
-
 United Kingdom
-
United States
-
 Uruguay
-
 Uzbekistan
-
 Venezuela
-
 Vietnam
-
 Yemen
-
 Zambia
-
 Zimbabwe
- Forex
- Crypto












