


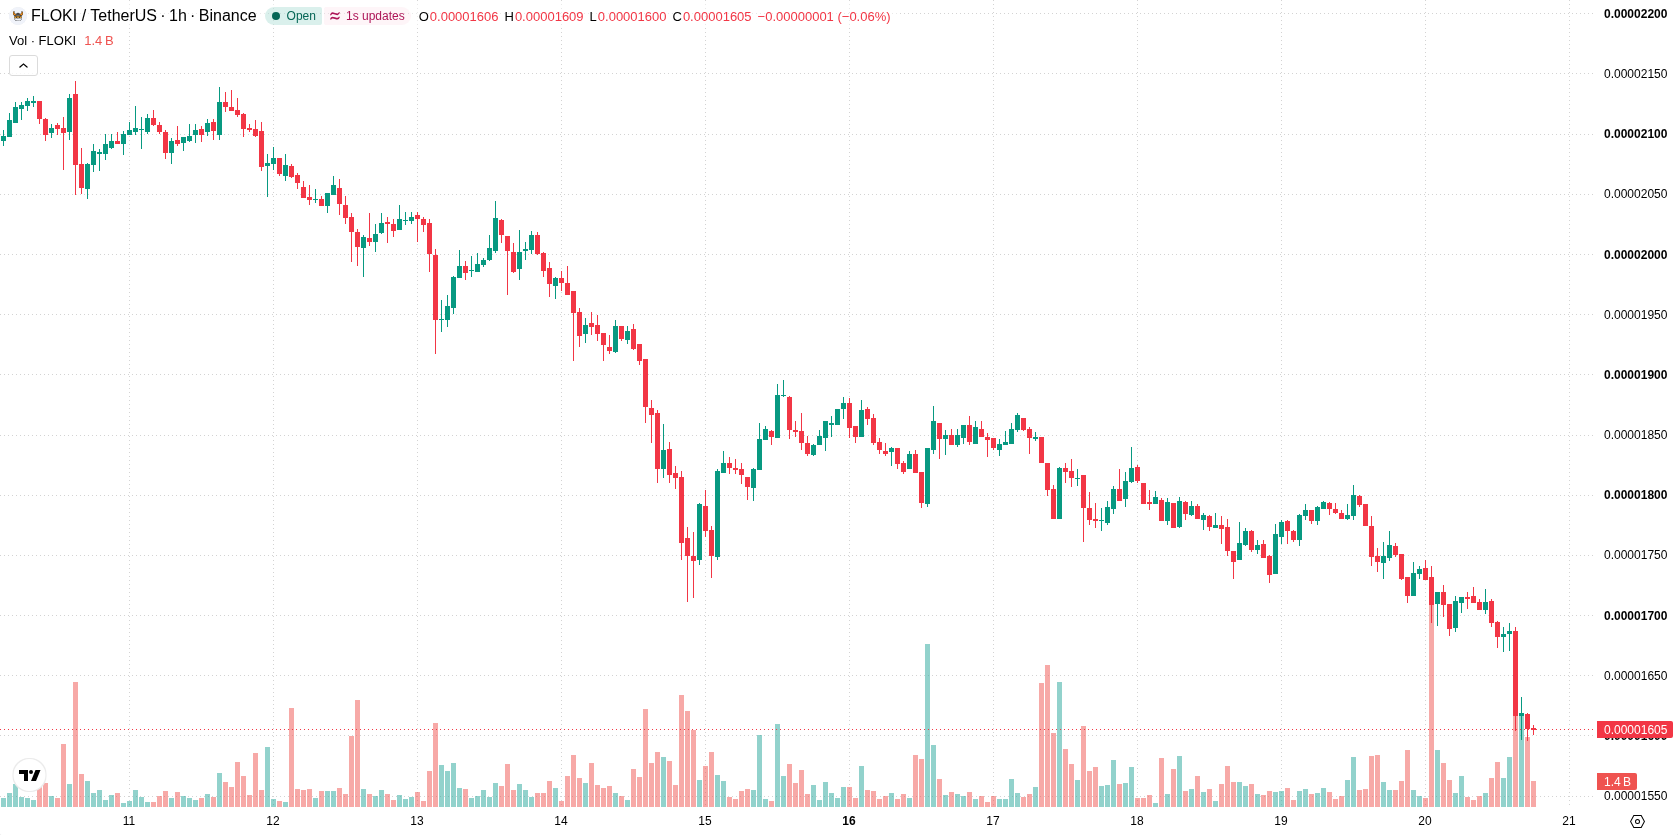
Floki Inu (FLOKI) is trading at $0.0000161, down 7.9% on the day. The price remains below its key moving averages, consistent with sustained downward momentum.
 0.0000175
0.00001990
Highlights
- FLOKI/USD trades below key moving averages on hourly and daily charts, signaling persistent downside momentum across all timeframes.
- Bearish momentum is confirmed by MACD and ADX, with RSI, Stoch RSI, and CCI all in oversold territory indicating selling exhaustion.
- Price is near daily lows, down 7.9% with high volatility, and is expected to remain in a $0.0000139 to $0.00001673 range over the next two to three days.
Strong bearish signals as oversold indicators hint at exhaustion
On the technical front, FLOKI is trading below the H1 SMA-20 at $0.00001694, H1 SMA-50 at $0.00001737, and D1 SMA-200 at $0.00002483. The Ichimoku Kijun at $0.00001683 forms immediate resistance above the current price. Momentum indicators present a clearly bearish environment: both MACD and ADX reflect continued selling strength, while RSI, Stoch RSI, and CCI are all situated in their respective oversold zones, pointing to the possibility of selling exhaustion but no assured rebound. Bull/Bear Power remains negative, signaling seller dominance within the session, and the Awesome Oscillator continues to show persistent downside momentum.
Elevated downside risk as upside scenario faces resistance
Over the next two to three trading days, FLOKI is expected to fluctuate within a $0.0000139 to $0.00001673 volatility band relative to current levels. The likelihood of a short-term move higher is very low, while the probability of further downside is elevated. The baseline scenario anticipates price action consolidating within this range; a bullish scenario would require a decisive break above immediate resistance, while further declines may develop if support at the lower end of the corridor gives way.
Earlier, analysts noted that Floki Inu had entered a period of mixed momentum, with short-term buyers emerging but no clear directional shift. The current analysis underscores a reinforcement of the bearish trend, making the lower boundary of the expected volatility band a critical level for traders to monitor over the coming sessions.










-
 Afghanistan
-
 Albania
-
 Algeria
-
 Angola
-
 Argentina
-
 Armenia
-
 Australia
-
 Austria
-
 Azerbaijan
-
 Bahamas
-
 Bahrain
-
 Bangladesh
-
 Belarus
-
 Belgium
-
 Bolivia
-
 Botswana
-
 Brazil
-
 Brunei
-
 Bulgaria
-
 Cambodia
-
 Cameroon
-
 Canada
-
 Chile
-
 China
-
 Colombia
-
 Congo
-
 Costa Rica
-
 Cote d'Ivoire
-
 Croatia
-
 Cuba
-
 Cyprus
-
 Czechia
-
 DR Congo
-
 Denmark
-
 Dominican Republic
-
 Ecuador
-
 Egypt
-
 El Salvador
-
 Estonia
-
 Eswatini
-
 Ethiopia
-
 Finland
-
 France
-
 Georgia
-
 Germany
-
 Ghana
-
 Greece
-
 Haiti
-
 Hong Kong
-
 Hungary
-
 India
-
 Indonesia
-
 Iran, Islamic republic
-
 Iraq
-
 Ireland
-
 Israel
-
 Italy
-
 Jamaica
-
 Japan
-
 Jordan
-
 Kazakhstan
-
 Kenya
-
 Korea
-
 Kuwait
-
 Kyrgyzstan
-
 Laos
-
 Latvia
-
 Lebanon
-
 Lesotho
-
 Libya
-
 Lithuania
-
 Luxembourg
-
 Madagascar
-
 Malaysia
-
 Malta
-
 Mauritius
-
 Mexico
-
 Moldova
-
 Mongolia
-
 Montenegro
-
 Morocco
-
 Mozambique
-
 Myanmar
-
 Namibia
-
 Nepal
-
 Netherlands
-
 New Zealand
-
 Nigeria
-
 North Macedonia
-
 Norway
-
 Oman
-
 Pakistan
-
 Palestine
-
 Panama
-
 Papua New Guinea
-
 Paraguay
-
 Peru
-
 Philippines
-
 Poland
-
 Portugal
-
 Puerto Rico
-
 Qatar
-
 Reunion
-
 Romania
-
 Rwanda
-
 Saudi Arabia
-
 Serbia
-
 Singapore
-
 Slovakia
-
 Slovenia
-
 Somalia
-
 South Africa
-
 Spain
-
 Sri Lanka
-
 Sweden
-
 Switzerland
-
 Syria
-
 Taiwan
-
 Tajikistan
-
 Tanzania
-
 Thailand
-
 Trinidad and Tobago
-
 Tunisia
-
 Turkey
-
 UAE
-
 Uganda
-
 Ukraine
-
 United Kingdom
-
United States
-
 Uruguay
-
 Uzbekistan
-
 Venezuela
-
 Vietnam
-
 Yemen
-
 Zambia
-
 Zimbabwe
- Forex
- Crypto












