

THORChain price forecast: Downward momentum persists beneath key technical levels

THORChain (RUNE) is trading at $0.478, marking a daily decline of 8.25%. The asset remains under pressure, holding beneath its key moving averages across short, medium, and long-term periods.
 0.516
0.5650
Highlights
- Hackers linked to the Binance breach recently transferred about $594 million in Ethereum through cross-chain protocols, mostly via THORChain.
- THORChain's 24-hour swap volume reached $239 million with protocol earnings of $243,000, driven by these illicit transactions and increasing operational risk.
- RUNE trades below key moving averages with bearish momentum, and the expected range for coming days is $0.438 to $0.4945.
Illicit fund flows through protocol amplify usage and sentiment risk
Hackers associated with the Binance breach recently moved around $594 million in Ethereum through cross-chain protocols, with the majority of these transactions routed via THORChain, according to Bitcoinist and Cointelegraph. This activity drove THORChain's 24-hour swap volume to $239 million and generated $243,000 in protocol earnings during the period, based on data from Cryptobreaking. While these figures indicate exceptionally high usage, the surge was triggered by the transfer of illicit funds, heightening operational and reputational risks for the protocol and weighing on market sentiment.
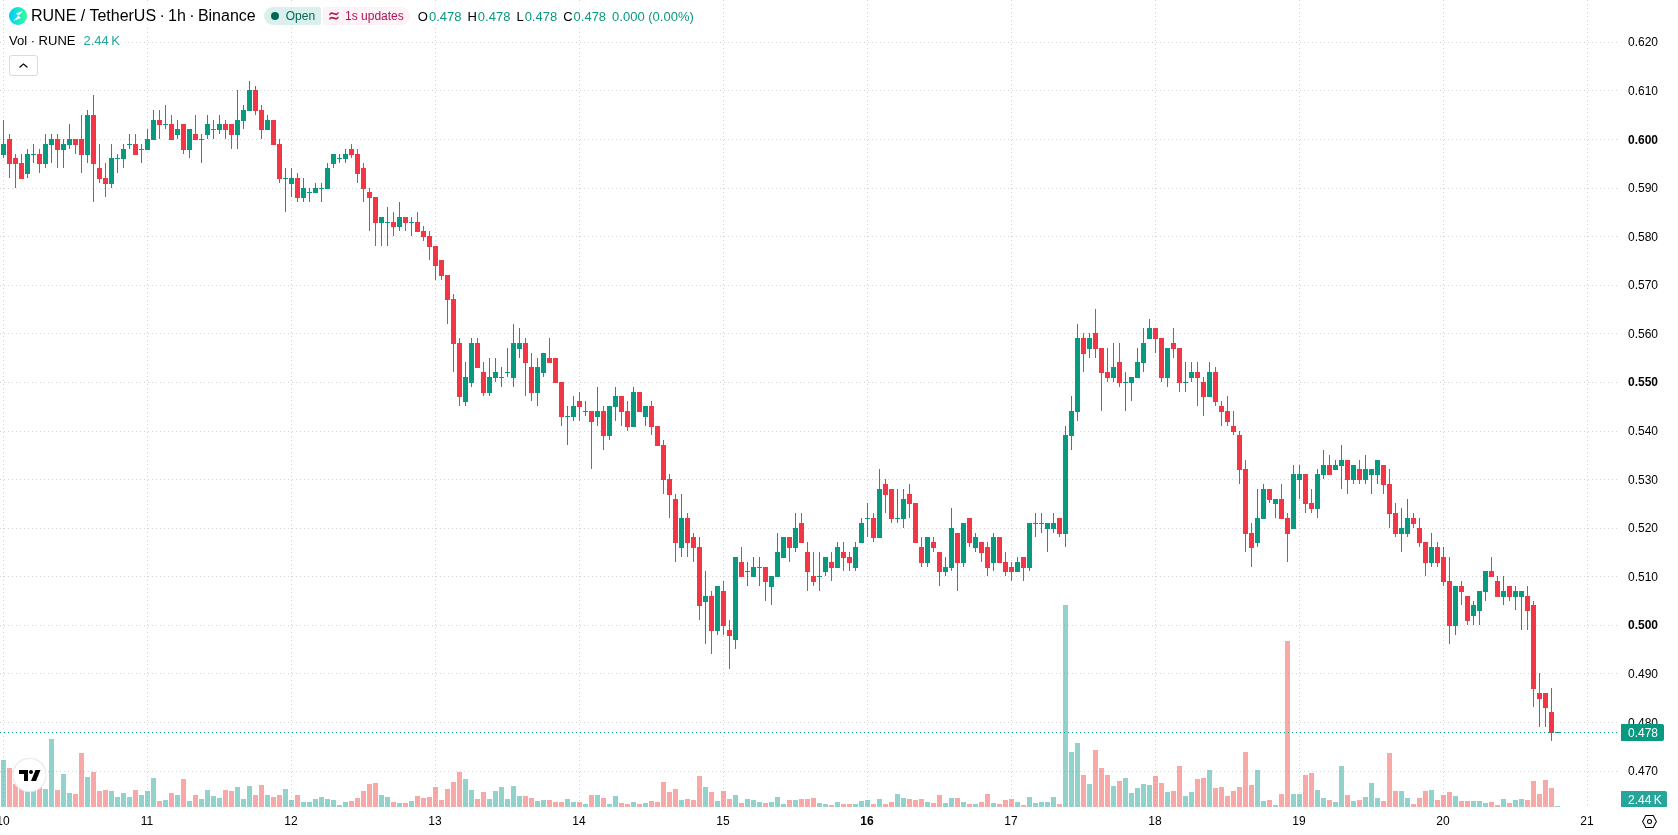
Bearish momentum deepens as oversold indicators and resistance converge
Technically, RUNE is positioned below several significant moving averages: the H1 SMA-20 at $0.5022, the H1 SMA-50 at $0.5166, and the D1 SMA-200 at $0.5063. Immediate resistance stands at the Ichimoku Kijun level of $0.5025. On the indicator front, MACD and ADX both register sell signals, while RSI, Stochastic RSI, and CCI are deeply oversold, indicating persistent selling pressure with potential for short-term exhaustion. Bull/Bear Power is negative at -0.0139, underscoring the dominance of sellers. The Awesome Oscillator is also in alignment with the prevailing bearish momentum, and current price action sits near session lows amid high volatility.
Downside bias prevails amid consolidation within volatile range
Looking ahead, the short-term outlook remains within a high-volatility band of $0.438 to $0.4945 over the next 2–3 trading days. The base scenario calls for consolidation in this range, with a continued downward bias prevailing. An upward reversal appears unlikely unless price breaks above immediate resistance at $0.5025, while further bearish continuation is favored if support at $0.438 is breached.
Previously it was reported that wallets tied to the Binance hack moved hundreds of millions of dollars in Ether via cross-chain protocols, with THORChain facilitating a significant share of these transactions. Against this backdrop of elevated protocol usage driven by illicit flows, traders should closely monitor the $0.438 level as a critical support, as further downside remains likely if this threshold fails to hold.











-
 Afghanistan
-
 Albania
-
 Algeria
-
 Angola
-
 Argentina
-
 Armenia
-
 Australia
-
 Austria
-
 Azerbaijan
-
 Bahamas
-
 Bahrain
-
 Bangladesh
-
 Belarus
-
 Belgium
-
 Bolivia
-
 Botswana
-
 Brazil
-
 Brunei
-
 Bulgaria
-
 Cambodia
-
 Cameroon
-
 Canada
-
 Chile
-
 China
-
 Colombia
-
 Congo
-
 Costa Rica
-
 Cote d'Ivoire
-
 Croatia
-
 Cuba
-
 Cyprus
-
 Czechia
-
 DR Congo
-
 Denmark
-
 Dominican Republic
-
 Ecuador
-
 Egypt
-
 El Salvador
-
 Estonia
-
 Eswatini
-
 Ethiopia
-
 Finland
-
 France
-
 Georgia
-
 Germany
-
 Ghana
-
 Greece
-
 Haiti
-
 Hong Kong
-
 Hungary
-
 India
-
 Indonesia
-
 Iran, Islamic republic
-
 Iraq
-
 Ireland
-
 Israel
-
 Italy
-
 Jamaica
-
 Japan
-
 Jordan
-
 Kazakhstan
-
 Kenya
-
 Korea
-
 Kuwait
-
 Kyrgyzstan
-
 Laos
-
 Latvia
-
 Lebanon
-
 Lesotho
-
 Libya
-
 Lithuania
-
 Luxembourg
-
 Madagascar
-
 Malaysia
-
 Malta
-
 Mauritius
-
 Mexico
-
 Moldova
-
 Mongolia
-
 Montenegro
-
 Morocco
-
 Mozambique
-
 Myanmar
-
 Namibia
-
 Nepal
-
 Netherlands
-
 New Zealand
-
 Nigeria
-
 North Macedonia
-
 Norway
-
 Oman
-
 Pakistan
-
 Palestine
-
 Panama
-
 Papua New Guinea
-
 Paraguay
-
 Peru
-
 Philippines
-
 Poland
-
 Portugal
-
 Puerto Rico
-
 Qatar
-
 Reunion
-
 Romania
-
 Rwanda
-
 Saudi Arabia
-
 Serbia
-
 Singapore
-
 Slovakia
-
 Slovenia
-
 Somalia
-
 South Africa
-
 Spain
-
 Sri Lanka
-
 Sweden
-
 Switzerland
-
 Syria
-
 Taiwan
-
 Tajikistan
-
 Tanzania
-
 Thailand
-
 Trinidad and Tobago
-
 Tunisia
-
 Turkey
-
 UAE
-
 Uganda
-
 Ukraine
-
 United Kingdom
-
United States
-
 Uruguay
-
 Uzbekistan
-
 Venezuela
-
 Vietnam
-
 Yemen
-
 Zambia
-
 Zimbabwe
- Forex
- Crypto












