

Can XRP withstand persistent ETF outflows and waning institutional demand?

XRP (XRP) is trading lower at $0.9108, declining 5.21% on November 21, 2026. Institutional outflows from US-listed spot XRP ETFs are weighing on demand and sentiment. Traders are watching for signs of stabilization in fund flows or a shift in investor positioning.
 0.9732
1.0078
Highlights
- US-listed spot XRP ETFs saw $19.13 million in net withdrawals, the largest weekly outflow since March 2026.
- Institutional exposure to XRP has decreased, contributing to reduced market liquidity and greater potential volatility.
- XRP trades below key moving averages with persistent bearish momentum, exposing the asset to further downside risk unless ETF outflows abate.
Institutional ETF outflows dampen demand for XRP
According to Coincentral, US-listed spot XRP exchange-traded funds experienced $19.13 million in net withdrawals in the week ending November 13, 2026, the largest single-week outflow since March. This marks a reversal from the initial strong demand seen when these products launched in November 2025.
The significant ETF outflows have reduced institutional exposure to XRP and signaled changing appetite for crypto assets among large investors. This has put additional selling pressure on XRP through risk-off flows, reducing overall market liquidity and contributing to potential volatility.
While no immediate counteracting events were reported, the scale of recent outflows highlights vulnerability to further shifts in sentiment, with typical volatility bands now reflective of increased uncertainty around institutional activity.
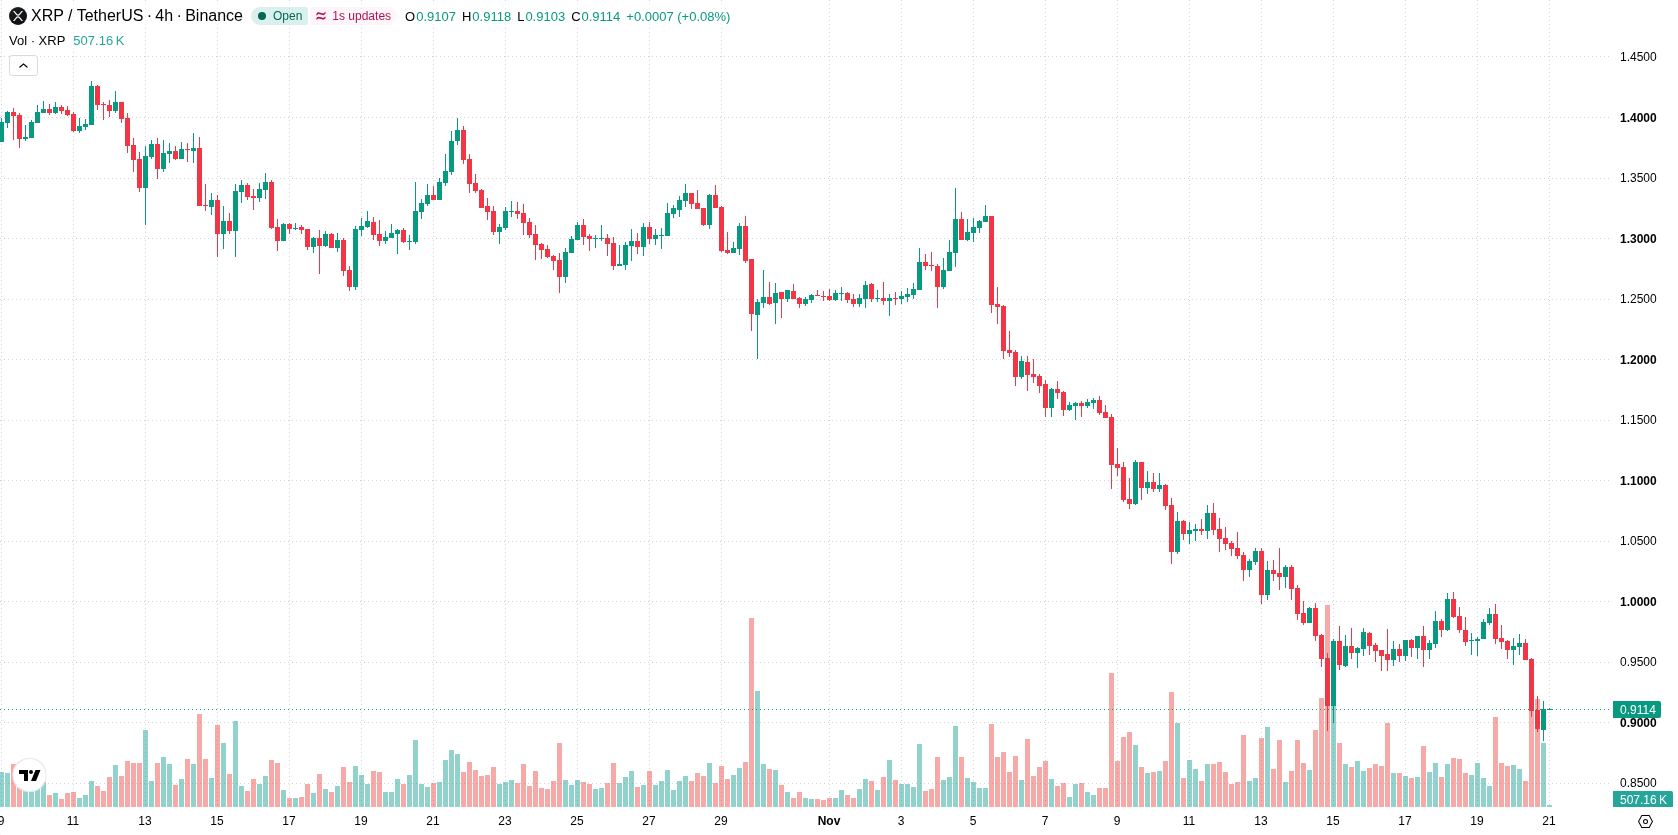
Bearish momentum persists with price below key averages
Technical readings on the 4H chart show XRP trading below the SMA-50 at $0.9754 and below the SMA-200 at $1.1786, indicating persistent weakness relative to recent averages. The price remains under the H4 Kijun resistance at $0.954, while momentum conditions remain negative.
With the RSI in oversold territory and both MACD and ADX signaling a continuation of bearish momentum, near-term pressure is pronounced. Mixed signals could develop if institutional demand stabilizes or reverses, but for now, the technical bias aligns with the prevailing downward trend.
Ongoing ETF withdrawals as critical risk, resistance at $0.95
Sustained ETF outflows present an ongoing risk to price stability for XRP. A move above the H4 Kijun resistance around $0.95 would be the first sign of improvement, while extended weakness below this level could leave the asset exposed to further losses. Monitoring changes in ETF flows and broader investor behavior remains key for confirming any potential turnaround.
Earlier, analysts noted that persistent institutional outflows from U.S. spot XRP ETFs and sustained technical weakness had amplified downside risks for XRP. The latest data reinforce this view, with recent record ETF withdrawals underscoring the need to closely monitor fund flows and investor positioning for any signs of a potential reversal.






Latest XRP News





-
 Afghanistan
-
 Albania
-
 Algeria
-
 Angola
-
 Argentina
-
 Armenia
-
 Australia
-
 Austria
-
 Azerbaijan
-
 Bahamas
-
 Bahrain
-
 Bangladesh
-
 Belarus
-
 Belgium
-
 Bolivia
-
 Botswana
-
 Brazil
-
 Brunei
-
 Bulgaria
-
 Cambodia
-
 Cameroon
-
 Canada
-
 Chile
-
 China
-
 Colombia
-
 Congo
-
 Costa Rica
-
 Cote d'Ivoire
-
 Croatia
-
 Cuba
-
 Cyprus
-
 Czechia
-
 DR Congo
-
 Denmark
-
 Dominican Republic
-
 Ecuador
-
 Egypt
-
 El Salvador
-
 Estonia
-
 Eswatini
-
 Ethiopia
-
 Finland
-
 France
-
 Georgia
-
 Germany
-
 Ghana
-
 Greece
-
 Haiti
-
 Hong Kong
-
 Hungary
-
 India
-
 Indonesia
-
 Iran, Islamic republic
-
 Iraq
-
 Ireland
-
 Israel
-
 Italy
-
 Jamaica
-
 Japan
-
 Jordan
-
 Kazakhstan
-
 Kenya
-
 Korea
-
 Kuwait
-
 Kyrgyzstan
-
 Laos
-
 Latvia
-
 Lebanon
-
 Lesotho
-
 Libya
-
 Lithuania
-
 Luxembourg
-
 Madagascar
-
 Malaysia
-
 Malta
-
 Mauritius
-
 Mexico
-
 Moldova
-
 Mongolia
-
 Montenegro
-
 Morocco
-
 Mozambique
-
 Myanmar
-
 Namibia
-
 Nepal
-
 Netherlands
-
 New Zealand
-
 Nigeria
-
 North Macedonia
-
 Norway
-
 Oman
-
 Pakistan
-
 Palestine
-
 Panama
-
 Papua New Guinea
-
 Paraguay
-
 Peru
-
 Philippines
-
 Poland
-
 Portugal
-
 Puerto Rico
-
 Qatar
-
 Reunion
-
 Romania
-
 Rwanda
-
 Saudi Arabia
-
 Serbia
-
 Singapore
-
 Slovakia
-
 Slovenia
-
 Somalia
-
 South Africa
-
 Spain
-
 Sri Lanka
-
 Sweden
-
 Switzerland
-
 Syria
-
 Taiwan
-
 Tajikistan
-
 Tanzania
-
 Thailand
-
 Trinidad and Tobago
-
 Tunisia
-
 Turkey
-
 UAE
-
 Uganda
-
 Ukraine
-
 United Kingdom
-
United States
-
 Uruguay
-
 Uzbekistan
-
 Venezuela
-
 Vietnam
-
 Yemen
-
 Zambia
-
 Zimbabwe
- Forex
- Crypto












